• Skip to main content
itrc_logo

LNAPL Update

Navigating this Website
1 Introduction
2 LNAPL Regulatory Context, Challenges, and Outreach
2 LNAPL Regulatory Context, Challenges, and Outreach Overview
2.1 Regulatory Challenges
2.2 Weather Vulnerabilities
2.3 Stakeholder Concerns, Community Outreach and Engagement
2.4 Streamlining the Corrective Action Process by Increased Communication
3 Key LNAPL Concepts
3 Key LNAPL Concepts Overview
3.1 Common Misconceptions
3.2 Life Cycle and Anatomy of an LNAPL Body
3.3 Overview of Natural Source Zone Depletion
3.4 LNAPL Thickness in Wells
3.5 States of LNAPL Saturation
3.6 LNAPL Recoverability and Transmissivity
3.7 Relation of LNAPL Saturation and Composition to Technology Selection
4 LNAPL Conceptual Site Model (LCSM)
4 LNAPL Conceptual Site Model (LCSM) Overview
4.1 How Much Data is Enough?
4.2 Initial LCSM
4.3 LNAPL Tools
4.4 Remedy Selection LCSM
5 LNAPL Concerns, Remedial Goals, Objectives, and Technology Groups
5 LNAPL Concerns, Remedial Goals, Remediation Objectives, and Remedial Technology Groups Overview
5.1 Identifying LNAPL Concerns
5.2 Establishing LNAPL Remedial Goals
5.3 Determining LNAPL Remediation Objectives
5.4 LNAPL Remedial Technology Groups
5.5 Establishing Remedial Performance Metrics and Remediation Endpoints
5.6 Integration of the LCSM and LNAPL Remedial Technology Selection
6 LNAPL Remedial Technology Selection
6 LNAPL Remedial Technology Selection Overview
6.1 Process Overview
6.2 Preliminary Technology Screening
6.3 Technology Evaluation
6.4 Technology Selection, Implementation, and Evaluation
Additional Information
Appendix A – LNAPL Technologies Appendix
Appendix B – Natural Source Zone Depletion (NSZD) Appendix
Executive Summary
1.0 Introduction
2.0 NSZD Processes and Theory
3.0 Incorporating NSZD into the LNAPL Site Management Process
4.0 Methods of NSZD Rate Quantification
5.0 Considerations in Long-term LNAPL site Management
Appendix C – Transmissivity (Tn) Appendix
1. Introduction
2.0 Field Methods to Measure Tn
3.0 Data evaluation and estimation of Tn – How do you estimate Tn?
4.0 Case Studies
Appendix D – Fractured Rock Appendix
1.0 Introduction
2.0 Fractured Rock Concepts and Technical Background
3.0 LNAPL Conceptual Site Model
4.0 Remedial Technologies
Appendix E – LNAPL Sheens Appendix
1.0 Introduction–What Are LNAPL Sheens?
2.0 What are Some Important Regulatory Requirements Concerning Sheens?
3.0 What Are the Common Sheen Forming Scenarios and Processes?
4.0 What Are Methods to Identify Petroleum Derived Sheens?
5.0 What Tools are Available to Assess Flux from Seeps?
6.0 Potential Sheen Mitigation Technologies
Acronyms
Glossary
Acknowledgments
Team Contacts
References
Document Feedback


LNAPL Update
HOME

4. LNAPL Conceptual Site Model (LCSM)

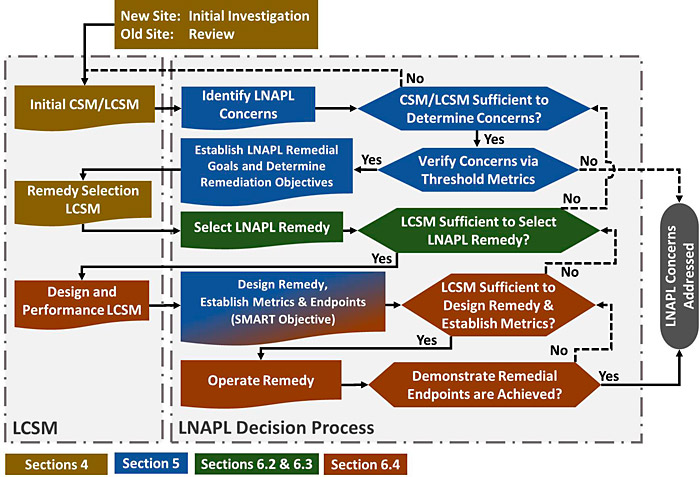
Figure 4-1. LNAPL conceptual site model (LCSM) stages and integration with LNAPL alternative evaluation.

The LCSM is the collection of information that incorporates key attributes of the LNAPL body with site setting and hydrogeology to support site assessment and corrective action decision-making. As with a conceptual site model for a non-LNAPL contaminated site, the LCSM integrates information and considerations specific to the LNAPL body relating to the risks of the contaminant source, exposure pathways, and receptors (for examples, see (ASTM 2014a). The content of the LCSM will typically evolve over time as different phases of the corrective action process require different information. What remains consistent is the emphasis in the LCSM on characterizing and understanding the source component, the LNAPL (see (ASTM 2014b)).

From the moment of release and as a site matures, ongoing NSZD processes can affect significant changes to the LNAPL body such as stability, mobility, and recoverability and associated dissolved- and vapor-phase plumes. Ongoing remediation can also contribute to continuing changes or be ineffective. A complete and up-to-date LCSM allows the best possible management decisions about application and operation of remedial technologies (see (ASTM 2014b)). Further, remedial action data provides important feedback on the LCSM; for example, effective attainment of objectives provides validation, while non-attainment of objectives is often rooted in an incomplete LCSM and misdirected use of a given technology. The LCSM may comprise some or all of the following scientific and technological information (hereinafter referred to as the “science”):

  • site setting (historical and current)—includes land use (as it informs potential sources), groundwater classification, presence and proximity of receptors, etc.
  • geological and hydrogeological information/setting
  • LNAPL physical properties (density, viscosity, interfacial tension, vapor pressure) and chemical properties (constituent solubilities and mole fractions)
  • LNAPL body spatial distribution (vertical and horizontal delineation)
  • LNAPL mobility and body stability information
  • LNAPL recoverability information
  • associated dissolved-phase and vapor-phase plume information (as it informs LNAPL distribution and pathways to receptor)
  • LNAPL natural depletion processes (including rate measurements or estimates, if available)

These elements were introduced in ITRC’s initial LNAPL guidance (LNAPL-1 and -2 documents), and for this update they have been grouped by the decisions that they support and transformed into the key questions in Section 4.2 and Section 4.4 that will help the investigator characterize, monitor, and understand LNAPL sources at their site. In answering the questions, the investigator will seek out the appropriate lines of evidence that bring the LNAPL concerns into sharper focus. This section is focused on what information is needed at what point for a given site. Section 3 provides insight to detailed LNAPL science. In addition, Section 4.3 includes a table summarizing LCSM data collection parameters, applicable tools, and educational references for investigation that may be useful in answering the key questions.

LNAPL source zones require utilizing lines of evidence which encompass microbiology, hydrogeology, petroleum chemistry, geochemistry, vapor transport. The reader must recognize the multifaceted aspects and utilize additional references provided throughout this document for detailed understanding of the LNAPL science.

The evolution of the LCSM during the corrective action is driven by the answers to questions shown in Figure 4-1 and by the three stages identified below:

  1. The Initial LCSM identifies concerns by defining the nature and extent of LNAPL and how it relates to receptors and pathways. (see Section 4.2)
  2. The Remedy Selection LCSM provides for remedy evaluation and selection of the most efficacious remedial technology or controls by characterizing aspects of the LNAPL and site subsurface relative to the potentially employed remedial mechanisms. (see Section 4.4)
  3. The Design and Performance LCSM provides remedy implementation support and guides termination, remedy transition, or optimization through monitoring remedy performance metrics relative to the remediation objective. (see Section 6.4.1)

Over the life cycle of a typical LNAPL site investigation and remediation, the LCSM may include, but does not necessarily require, the three stages of evolution, each with a specific focus and a specific set of outcomes.

At the first stage, the focus of the Initial LCSM is the identification of one or more LNAPL concerns. An LNAPL concern is an LNAPL condition or potential condition that could:

  • pose a risk to health or safety;
  • result in additional LNAPL migration;
  • address an LNAPL-specific regulatory requirement; or
  • create some other physical or aesthetic impact or other specific regulatory or stakeholder requirement.

A well-developed Initial LCSM summarizes LNAPL and site conditions sufficiently to guide the identification and refinement of LNAPL concerns. Some LNAPL concerns may be readily identified in the early stages of site characterization, and others may be identified or further refined. It is recommended that the Initial LSCM includes sufficient information to verify LNAPL concerns using threshold metrics where available, and to establish Remedial/Control Goals. Section 5 provides further information on verifying initial LNAPL concerns, and translating verified LNAPL concerns into an LNAPL remedial strategy. This process is illustrated in Figure 4-1 in the blue steps and the initial green step.

At the second stage, the focus of the LCSM shifts to selecting potential remedial options. The outcome of the Remedy Selection LCSM is the identification of one or more LNAPL remedies or controls that address the verified LNAPL concerns. The Remedy Selection LSCM should include sufficient information to select appropriate remedies or control measures that are capable of abating the verified LNAPL concerns. These steps are illustrated by the green steps in Figure 4-1. Section 5 and Section 6 provide further information on selecting an LNAPL remedy/control strategy.

As illustrated by the red steps in Figure 4-1, in the third stage, the focus of the LCSM shifts to designing and implementing the selected remedial measures or controls, establishing technology-specific remediation objectives, and assessing progress and performance toward identified technology-specific remediation endpoints. The outcome of the Design and Performance LCSM is the implementation of one or more LNAPL remedies or controls that can achieve the established remediation objectives. The Design and Performance LCSM should include sufficient information to establish remediation objectives, design and implement remedies or control measures, and track progress toward defined remediation endpoints. Section 5 and Section 6 provide further information on establishing remediation objectives, implementing remedies, and identifying and tracking progress toward remediation endpoints.

The level of detail required in an LCSM for a specific site is a function of the complexity of environmental conditions, potential risk considerations, the regulatory framework, and overall LNAPL site management and remediation objectives (ASTM 2014b).

4.1 How Much Data is Enough?

ASTM International (ASTM 2014b) advocates development of an LCSM to evaluate LNAPL sites in a manner consistent with the Risk-Based Corrective Action (RBCA) process (see ASTM E1739–95 (ASTM 2015)) for more information about the RBCA process). ASTM identifies three tiers of LCSMs based on site complexity: Tier 1, Tier 2, and Tier 3 (with site complexity and LCSM requirements increasing with tier levels). Generally speaking, the LCSM for a given site is deemed adequate (in terms of level of detail) when the existing understanding is sufficient for the stakeholders to agree on a path forward. Ultimately, however, the judgment of the environmental professionals (e.g., environmental consultants, implementing agencies, responsible parties) is used to assess whether sufficient information has been gathered to make appropriate management decisions.

Figure 4-2 illustrates how as the level of risk or complexity of a site increases, a higher tier of LCSM is useful to provide sufficient information for decision making (after (ASTM 2014a)). This higher tier of information could be higher data density (spatial or temporal), or additional tools for a given line of evidence (e.g., geology or LNAPL composition). For example, in certain situations, where the size of the LNAPL body is relatively small and soil excavation is adequate to satisfy remediation objectives, the LCSM may be limited to spatial distribution, and further evaluation of LNAPL degradation or mobility are unnecessary. In other situations, where excavation is not feasible, the LCSM requires this additional detail.

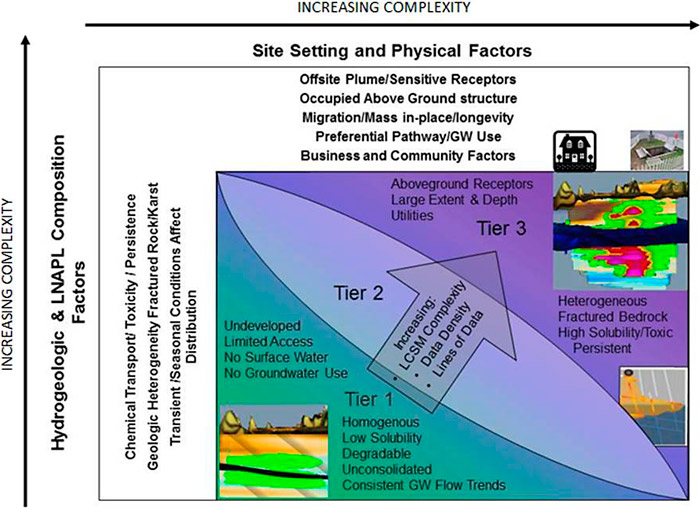
Figure 4-2. Factors governing 1) the potential to achieve a significant reduction in risk and 2) the cost of LNAPL depletion (arrows point in the direction of increase of the noted property). (adapted after (ASTM 2014a)).

It is important to note that a single factor may not increase the level of complexity by itself. Rather, if that factor results in challenges to remediation or confidence in the remedial decision, then the tier is increased. For example, a source zone in heterogeneous soil can either be a tier 3 or a tier 1. Where the source is shallow, the release history is known, and excavation can be performed, a tier 1 LCSM may be appropriate. In the event that excavation is not feasible or desirable due to cost, then additional information may be needed to characterize the distribution of impacts for alternate remedy evaluations. The additional data would identify cost and performance of alternate remedies for more informed decision making.

LNAPL sites are typically evaluated using various elements, including:

  • historical data (e.g., LNAPL and dissolved phase footprint evolution, LNAPL occurrence versus potentiometric surface elevation, facility release record, and/or operational record);
  • field data such as product recovery rates from interim measures, transmissivity values from baildown testing, and/or tracer dilution tests;
  • site-specific laboratory data (e.g., TPH profiling and LNAPL saturations in soil cores);
  • analytical and/or numerical modeling results;
  • LNAPL risk assessment issues (including the consideration of both current and potential future site conditions);
  • high resolution characterization data (e.g., DC resistivity, conductivity, LIF, and MIP); and
  • combinations of the above.

The extent to which one particular line of evidence may be needed for the LCSM depends on other available lines of evidence. For example, at a site where there are little or no historical data or where the data sets are extremely sparse, there will be a stronger need for extensive sampling to obtain site-specific laboratory data, possibly supplemented with modeling that incorporates the new data to characterize LNAPL mobility and body stability issues. Conversely, at a site with an abundance of historical data covering the range of water table fluctuations, there will likely be less need to engage in a comprehensive laboratory program or modeling to develop the LCSM. Utilizing this thinking with the tiered concept in Figure 4-2 will support the overall litmus test for an LCSM – is there agreement by all stakeholders that sufficient information is available to make decisions to advance the site forward?

4.2 Initial LCSM

The Initial LCSM is utilized to support identification of concerns, verifying those with the threshold metrics (Section 5.1.1 and Table 5-1) and ultimately defining remedial goals (Section 5.2). Often data collected in the Initial LCSM will support additional portions of the LCSM and may be collected for efficiency of field mobilizations. However, it is not always plausible to understand the concerns, the remedial path forward, and the requirements for remedial design until an initial LCSM is created. A logical step is to collect sufficient information to understand the concerns and then verify them with threshold metrics. As discussed in Section 5.1, the primary categories of concerns include Risk and Safety, Migration, LNAPL Occurrence, and Other Concerns.

The questions described in this section were designed to guide an investigator through the key components of developing the concerns portion of the Initial LCSM. This represents the first steps shown in Figure 4-1.

While there are many questions that can be answered for a site, not all are necessarily relevant or required depending on the level of detail required for the LCSM. The questions in this section are widely applicable to LNAPL sites as they generally have to be answered to develop the LCSM for understanding concerns, risks, and LNAPL source distribution—from the most general (green) to more LNAPL specific concepts (brown).

1. Is current and future land use known? ▼Read more

The relevance of land use (both on-site and off-site) is of primary importance due to determination of exposure pathways (Question 8); the establishment of site cleanup goals; and any local, state, and federal requirements for institutional controls or other physical controls. Information regarding past and future land use and possible release(s) may dictate how aggressive a remedy needs to be to meet those cleanup goals, but may also limit the extent to which a remedy can be applied if the site is an active industrial facility or much of the site is covered by buildings or other structures that limit accessibility.

2. Does the potential for preferential pathways exist? ▼Read more


What will this tell me about the LNAPL body?
Read More

The potential for preferential pathways for flow and transport can be identified based on local and regional geology, geomorphology, and site setting. These preferential pathways can create conveyances for LNAPL to migrate at a rapid rate relative to the surrounding matrix, over longer distances, and in directions that might not otherwise be expected.

How is the answer informed by the below categories: Read More

  • Site setting, current and future land use, potential receptors

Site setting can help identify the existence and location of anthropogenic preferential pathways. These features can provide conduits for exposure inconsistent with what is expected in a typical soil matrix and can convey LNAPL vapor (ITRC 2011), and/or dissolved impacts over longer distances.

  • Site geology and hydrogeology

Understanding the distribution of preferential pathways in different geologic and hydrogeologic settings (e.g., heterogeneous unconsolidated soil, karst, and fractured rock) and the degree of anisotropy will better enable the investigator to understand the LNAPL migration potential relative to receptors. Preferential pathways should be evaluated and understood in both the vadose and saturated zones.

Varied stratigraphy can result in anisotropic LNAPL occurrences. Void spaces can also create collection points for LNAPL that can serve as persistent source areas for dissolution to groundwater and for LNAPL sources to the surrounding matrix. Characterization should account for soil variability influencing the anisotropy. This can be done with a simple increased boring and well density, but often improved approaches utilize the stratigraphy to strategically locate the same number of borings and wells and/or couple with tools such as geophysical or high resolution borings to provide an improved understanding with fewer wells for increased confidence in the LCSM. Preferential pathways for flow and transport may also exist in fractured rock, which is further discussed in the Fractured Rock Appendix.

  • LNAPL body spatial distribution/extent

Permeable soil layers may intersect a utility corridor or other preferential pathway, which results in anisotropic distribution and transport of LNAPL, vapor, and/or dissolved phase impacts. LNAPL can more easily flow through more permeable units as well as achieve a higher degree of impact within the matrix for a given release. Cross-sections and/or illustrations of the LNAPL body extent that include utilities and stratigraphic information are useful in illustrating the spatial relationship of the LNAPL impacts to site geology and anthropogenic subsurface features.

  • Dissolved and vapor phase plume characterization

Dissolved and vapor impacts at greater distances or different locations than expected may be an indicator of an LNAPL intersecting a preferential pathway.

What information might already exist about a site that would help answer this question? Read More

Information included in the Phase I environmental site assessment (ESA), including local and regional geology, is often sufficient to provide a reasonable understanding of any anthropogenic preferential pathways. When combined with initial delineation activities (e.g., Phase II investigations or initial site characterization), Phase I ESA information can then be used to screen for the preferential pathways as a receptor or migration pathway.

What is the minimum information that might answer this question and what would that simple LCSM look like? Read More

Where no pathways exist, the pathways do not lead to receptors, or the LNAPL body does not intersect pathways, the information above is sufficient; where the potential exists, then additional investigation using a systematic elimination approach is often needed. This can include sampling alternate pathways to confirm they are not a complete pathway if a receptor is known to be impacted. Reporting includes a narrative, maps, cross-sections, site setting information, and soil borings.

What are more detailed data that might answer this question and what would that more complex LCSM look like? Read More

While the minimum consists of site setting review, LNAPL body, and dissolved and vapor phase extents, any remaining uncertainty related to risk and preferential pathways could be addressed with additional lines of evidence that provide confidence and utilize the existing sampling network (e.g., a period of resampling of wells and receptor points). Additional borings utilizing standard or high resolution tools, or a sampling frequency based on seasonal or other expected changes in transport potential, may be required.

What additional data is appropriate for the next steps in the evolution of the LCSM (i.e., remedy selection LCSM, remedy performance LCSM)? Read More

A higher density of data points that characterize the site’s heterogeneity in addition to modeling, pilot studies, or bench scale studies may be required due to the added complexity of a site where preferential pathways dominate.

3. How does stratigraphy relate to affecting impacts and potential migration? ▼Read more


What will this tell me about the LNAPL body?
Read More

Soil type variations can influence the distribution of LNAPL as well as contaminant migration pathways. The depositional environment may result in natural anisotropy that can be inferred from existing geomorphology and regional geologic literature. Many physical soil properties can be estimated via visual logging, cone penetrometer, hydraulic profiling, and/or grain size analysis.

How is the answer informed by the below categories? Read More

  • Site geology and hydrogeology

Site geology and hydrogeology provide a framework for understanding the preferred distribution of LNAPL upon being released to the subsurface. Typically, coarser materials are preferred over finer-grained. In addition, the confined/unconfined state of the impacted aquifer unit(s) stratigraphy should be understood. Areas of perched groundwater that are impacted with LNAPL can also serve as sources to underlying aquifer units.

  • LNAPL body spatial distribution/extent

The extent of LNAPL compared to geology/hydrogeology and other site features will highlight the pathways of highest migration potential. Areas of higher permeability soils typically allow for a larger spatial extent of an LNAPL body than low permeability zones. In addition, the confined/unconfined state of the impacted aquifer unit(s) stratigraphy are important to understand as increases in gauged LNAPL thickness may be correlated to water table fluctuations rather than migration. Water table fluctuations can result in intermittent and non-uniform LNAPL occurrences for unconfined, perched, and confined conditions; in such instances, mobile LNAPL distribution will not be uniform and may be intermittent.

  • LNAPL mobility

Evaluation of LNAPL mobility alone does not give a direct indication of LNAPL migration. Migration is the result of LNAPL being transmissive, exposed to a gradient such that the overall flux is greater than the total losses. The assessment of LNAPL mobility needs to be combined with other quantified factors.

Monitoring the magnitude of LNAPL mobility over time and accounting for seasonal water table fluctuations can be useful in monitoring plume stability. LNAPL mobility can be quantified using field transmissivity tests (Transmissivity Appendix). Quantification of mobility using gauged LNAPL thickness and soil capillary and permeability properties, combined with LNAPL physical fluid properties and LNAPL saturation soil samples, can support field transmissivity testing, but are difficult to utilize alone for quantifying LNAPL mobility.

Quantification of LNAPL mobility requires an understanding whether the LNAPL is confined, unconfined, or perched no matter the methodology.

What information might already exist about a site that would help answer this question? Read More

For a new release with no prior investigation, the only information that may be available is a regional geologic map, aerial photography, and possibly some state well reports for water wells located adjacent to the site. The EPA Hydrocarbon Spill Screening Model is also available to screen the vertical migration rates for a given spill (EPA 1997).

Existing boring logs, monitoring well logs, and fluid gauging measurements can be used to evaluate LNAPL body stability (see Section 3.5.2) for previously investigated sites. The boring logs should encompass the aerial and vertical extent of an LNAPL body and dissolved and vapor impacts.

What is the minimum information that might answer this question and what would that simple LCSM look like? Read More

Visual observations from soil borings delineating source areas and dissolved and/or vapor phase can be utilized to confirm and refine the depositional setting suggested from regional soil geology reports. This information would be sufficient to develop cross-sections and a general written description to support answering each of the other questions described in this document.

What are more detailed data that might answer this question and what would that more complex LCSM look like? Read More

As complexity increases or if the project requires a remedy, additional definition of the soil profile using high resolution tools or quantification of soil parameters such as hydraulic conductivity (see Section 4.3) for additional parameters) would be expected.

What additional data is appropriate for the next steps in the evolution of the LCSM (i.e., remedy selection LCSM, remedy performance LCSM)? Read More

Collecting soil, groundwater, and vapor samples from fringes and within source plumes can support improved understanding of dissolved and vapor phase fate and transport and biodegradation processes. A variety of tools exist to develop proper characterization and are further described in Section 4.3.

4. Is the source and extent of the LNAPL known? ▼Read more


What will this tell me about the LNAPL body?
Read More

Understanding the extent of LNAPL is required to understand the concerns posed by the LNAPL, including potential dissolved, vapor, and surface water concerns. The extent to which LNAPL delineation occurs (i.e., applicability of vertical, up-gradient, downgradient, and side-gradient directions) will be based upon the ultimate remedial endpoints and the scale and potential complexity of the site, subsurface, and LNAPL extent. The source can extend above and below the water table and occur as mobile or residual LNAPL. Residual LNAPL identification requires visual soil logging, shake tests, soil samples, LIF, or alternate forms of delineation.

How is the answer informed by the below categories? Read More

  • Site setting, current and future land use, potential receptors

The locations of petroleum storage and processing can identify potential release source areas. Building foundations could be barriers to LNAPL migration, building drainage systems may provide preferential migration pathways, locations of operations or buildings can prevent or influence investigations in certain locations, and migration across property boundaries can either prevent investigations in certain locations or make access agreements necessary.

  • LNAPL release details (location, timing, volume)

Potential release locations are useful starting points to understand where LNAPL could migrate and inform where to focus delineation activities. Where known, the volume and timing of a release can identify if the plume is expected to be stable or migrating. Experience by ITRC LNAPL Update team members indicates that the majority of plumes stabilize within six months to a few years post-release. Ultimately, the time for any release to stabilize is dependent on LNAPL type, loss rate, release rate, and subsurface characteristics.

  • Site geology and hydrogeology

Site geology and hydrogeology provide clues on the lateral and vertical extent of the LNAPL body because they provide constraints on its migration. For example, fine-grained soil could constrain vertical extent causing perched or confined LNAPL conditions (reference basic concepts). Lateral extent is influenced by locations of more permeable soils and/or pathways.

The LNAPL extent should be considered in context with historical water table elevations, particularly where there have been extreme fluctuations in water level. Additionally, while LNAPL migration is influenced by the groundwater gradient, LNAPL heads during the early stages of release can be sufficient when combined with more permeable soils to allow up-gradient migration during the release.

  • Dissolved and vapor phase plume characterization

Information on vapor phase characterization can be found in the ITRC PVI guidance document (ITRC 2014). Vapor phase concentrations represent indirect evidence of the presence of LNAPL. Decreasing dissolved phase concentrations or a consistent center of dissolved mass can indicate stability of an LNAPL source body. Increasing concentrations indicate the need to further evaluate stability of the LNAPL source body unless attributable to other factors such as seasonal changes in groundwater flow conditions.

What information might already exist about a site that would help answer this question? Read More

In addition to the LNAPL release details, there may be state records from drinking water well installation, previous environmental investigations, and previous geotechnical investigations at the site or neighboring sites that can be used to show presence or absence of LNAPL.

What is the minimum information that might answer this question and what would that simple LCSM look like? Read More

At a minimum, it is recommended that enough data be collected to understand the spatial extent and critical data gaps be filled. Field screening observations from a tank removal or soil borings are examples of information that could support a simple LCSM. It is suggested that a narrative with plan view and cross-sectional maps that depict the lateral and vertical extent of the LNAPL be developed.

What are more detailed data that might answer this question and what would that more complex LCSM look like? Read More

A more complex LCSM could include three-dimensional representation of the LNAPL body relative to heterogeneous subsurface, key site aspects such as utility corridors, surface water features, and other receptors. A variety of delineation tools and techniques are presented in the LCSM table in Section 4.3.

Because several of these tools are indirect indicators, practical experience in their application may be helpful to properly apply and interpret them.

Are the detailed data more appropriate for the next steps in the evolution of the LCSM (i.e., remedy selection LCSM, remedy performance LCSM)? Read More

Further delineation may include LNAPL body stability evaluations, identification of residual LNAPL areas, and internal delineation of LNAPL components, or potential exposure pathways.

5. Are dissolved or vapor issues expected based on LNAPL composition?▼Read more


What will this tell me about the LNAPL body?
Read More

Understanding the LNAPL composition and chemical properties, and its effect on dissolved and vapor phase plume concentrations provides data to help interpret and support the assessment of the LNAPL body extent and related risks. When an LNAPL release potentially poses an unacceptable human health or ecological risk, it is often a result of specific components in the LNAPL rather than the magnitude of TPH in soil, the LNAPL saturation, or mobility of the LNAPL (see (ITRC 2018)). Understanding if the LNAPL composition has the potential to or is likely to cause dissolved or vapor issues, helps the practitioner plan site investigation work, collect data to document the dissolved and vapor phase concentrations, and/or collect data to assess remedial technologies that result in composition changes.

How is the answer informed by the below categories? Read More

  • Site setting, current and future land use, potential receptors

Information on the current and future land use and receptors allows assessment of whether the dissolved and vapor plumes present potential current or future risks, which may influence the need for and prioritization of remedial actions.

  • LNAPL type, composition, physical properties

Knowledge of the fuel type and composition can be used to estimate the constituents of concern and resulting vapor and dissolved phase concentrations in equilibrium with the LNAPL.

What information might already exist about a site that would help answer this question? Read More

Knowledge of the release details such as the LNAPL type (e.g., gasoline, diesel, heating oil, JP4, crude oil), age (recent release vs. decades-old release), release location, volume, and depth to groundwater can provide general information on the likelihood of dissolved phase and vapor phase issues.

What is the minimum information that might answer this question and what would that simple LCSM look like? Read More

The type and composition of the LNAPL is needed to understand the risk of dissolved and vapor phases that can be expected at a release site. Dissolved phase plumes emanating from LNAPL may be expected:

  • in and downgradient from smear zone and saturated zone LNAPL bodies of lighter and more soluble hydrocarbons;
  • below vadose zone LNAPL bodies of lighter and more soluble hydrocarbons; and
  • in and immediately downgradient from smear zone and saturated zone LNAPL bodies of less soluble hydrocarbon mixtures.

Vapor phase plumes emanating from LNAPL that have the potential to cause issues if receptors are present may be expected:

  • to overlie the LNAPL body where the LNAPL body is within approximately 15 feet of an occupied structure. If the LNAPL body is more than approximately 15 feet below grade then the vapors are likely mitigated (ITRC 2014).
  • to overlie dissolved phase hydrocarbon plumes where the water table is within approximately 5 feet of the bottom of building. If the dissolved phase plume is more than approximately 5 feet below grade, then the vapors are likely attenuated.
  • where basements or elevator shafts exist below grade; these features should be considered when comparing to the screening distances provided above.

What are more detailed data that might answer this question and what would that more complex LCSM look like? Read More

Detailed estimates of the dissolved phase and vapor phase concentrations can be made based on laboratory analysis of LNAPL samples or soil samples containing residual or mobile LNAPL. The laboratory analysis may characterize the VOC, PAH and bulk hydrocarbon concentrations in aromatic and aliphatic equivalent carbon groups (as recommended by (TPHCWG 1997) and (ITRC 2018)). The calculation of equilibrium LNAPL-water and equilibrium LNAPL-vapor concentrations is based on four-phase partitioning using Raoult’s Law.

The results of the vapor phase concentration estimates can be used as input to vapor intrusion models such as BioVapor (API 2010). The results of the LNAPL-water dissolved phase calculations can be used:

  • to help interpret groundwater sample data (e.g., assess whether groundwater samples contain LNAPL or polar biodegradation metabolites);
  • along with dilution-attenuation factors to calculate groundwater concentrations at specific points of interest; and
  • as input for dissolved phase transport models to assess the potential extent of and risk associated with the dissolved phase plumes.

The results of the dissolved and vapor phase concentration calculations can also be used to assess the degree of compositional change required for remedial options relying on compositional changes. In practice, it is likely that the dissolved phase plume delineation would be based on or supported by groundwater sampling.

What additional data are appropriate for the next steps in the evolution of the LCSM (i.e., remedy selection LCSM, remedy performance LCSM)? Read More

Tracking of LNAPL composition over time may assist remedy performance evaluation during the implementation phase.

6. Are dissolved or vapor plumes characterized?▼Read more


What will this tell me about the LNAPL body?
Read More

The extent and nature of dissolved and vapor plumes may be required to assess the concerns related to the site, and can help inform the practitioner on the presence and location of LNAPL.

How is the answer informed by the below categories? Read More

  • Site setting, current and future land use, potential receptors

Both current and future land use need to be considered in assessing the appropriate extent of dissolved or vapor plume characterization to identify current and future potential receptors.

  • Site geology and hydrogeology

Geology and hydrogeology are critical considerations in exposure pathway assessment, particularly with respect to transport mechanisms from a contamination source to a receptor exposure point. Additional discussion is provided under the site geology/hydrogeology and preferential pathways discussion.

  • LNAPL mobility

If LNAPL is migrating, then the delineation of ultimate dissolved and vapor phase plume extents will not be complete until LNAPL migration ceases or its ultimate extent can be confidently projected.

  • Natural degradation processes

Natural degradation processes are important to understanding the transport of petroleum contaminants from the source to an exposure point for LNAPL, dissolved phase, and petroleum vapor impacts. Natural degradation is further discussed in the NSZD Appendix.

What information might already exist about a site that would help answer this question? Read More

An existing monitoring well network and historical dissolved phase data can provide insights to dissolved delineation as well as LNAPL body delineation. Concentrations that approach the effective solubility or vapor pressure for a given constituent can be a screening level indicator of LNAPL being present near the sample location.

What is the minimum information that might answer this question and what would that simple LCSM look like? Read More

Delineation of affected groundwater to the specified or agreed-upon screening criteria is necessary to develop an LCSM. Screening assessment of potential vapor plumes can be based on depth to LNAPL and LNAPL composition, and depth to water and constituents of concern (COC) concentrations in groundwater.

What are more detailed data that might answer this question and what would that more complex LCSM look like? Read More

If distance-based screening of LNAPL and/or groundwater data indicates a potential vapor intrusion concern, the LCSM may require soil gas, sub-slab gas, or indoor air data to fully evaluate vapor intrusion potential. As site geology complexity increases, additional delineation points may be required (e.g., membrane interface probes, wells, etc.). Multiple sources could create the need for specialized sampling techniques such as forensic compositional analyses or compound specific isotope analyses.

What additional data is more appropriate for the next steps in the evolution of the LCSM (i.e., remedy selection LCSM, remedy performance LCSM)? Read More

Dissolved gases and higher vertical resolution COC sampling may be utilized for enhanced understanding of biodegradation mechanisms and remedy performance.

7. Do soil or groundwater concentrations exceed criteria? ▼Read more


What will this tell me about the LNAPL body?
Read More

The presence of COCs in soil, groundwater, or soil vapor at concentrations exceeding applicable criteria at compliance points identifies the need for remediation or alternate protection of receptors, in addition to remediation or control of the LNAPL source.

How is the answer informed by the below categories? Read More

  • Site setting, current and future land use, potential receptors

Soil concerns apply primarily to the original LNAPL release point or when the LNAPL smear zone is shallow enough for potential receptor contact (e.g., future construction workers). Soil vapor should be assessed in consideration of existing or future planned buildings. Groundwater can be assessed in consideration of groundwater usage and ecological concerns.

  • LNAPL release details (location, timing, volume)

Understanding the location, timing, and volume of an LNAPL release will help the investigator understand the potential for soil and dissolved phase impacts. If the release duration was short and/or volume was small, the extent of lateral and vertical delineation of soil or groundwater impact may be reduced. However, as the duration and size of the release grows, the extent of impact may increase. If the release is older than one year, then NSZD processes require consideration to assess plume stability (NSZD Appendix). Areas of perched LNAPL or groundwater may serve as sources to underlying aquifer units.

  • Natural degradation processes

Understanding the occurrence and impact of natural degradation processes under site-specific circumstances is useful for assessing long-term plume behavior and risk. At any given location, natural degradation processes can result in significant reductions in dissolved or vapor phase COC concentrations over periods of time that are relevant to risk-based site management. While natural processes may effectively restore aquifer conditions, if receptors are currently exposed to unacceptable risks, it is not advised to solely rely on natural degradation processes for protection.

What information might already exist about a site that would help answer this question? Read More

Existing dissolved phase data provide direct evidence of groundwater concentrations. Depths to soil or groundwater impacts can be compared to screening distances for PVI. LNAPL compositional data can help estimate the likelihood of environmental media having COC concentrations above applicable criteria. For more information on this aspect, refer to Question 5: Are dissolved or vapor issues expected based on LNAPL composition?

What is the minimum information that might answer this question and what would that simple LCSM look like? Read More

Soil and groundwater concentrations require comparison to applicable screening criteria. The groundwater and LNAPL source depths relative to existing buildings are needed to screen PVI concerns. Note that some regulatory agencies may also require vapor assessment data.

What are more detailed data that might answer this question and what would that more complex LCSM look like? Read More

Exceeding applicable criteria may trigger the need for more refined delineation of the extent of impact. Quantification of remedy performance is beneficial when a remedy is implemented to address exceeded values at compliance points. The LCSM can be further developed to provide quantitative and qualitative indicators of the potential performance of various remedial mechanisms to support remedial selection. Section 6 and the LNAPL Technologies Appendix can provide more information on data needs for a more complex LCSM as a site moves toward a remedy.

What additional data are appropriate for the next steps in the evolution of the LCSM (i.e., remedy selection LCSM, remedy performance LCSM)? Read More

Tracking changes in soil or groundwater concentrations over time can be useful for assessing remedy performance.

8. Are exposure pathways complete or incomplete? ▼Read more


What will this tell me about the LNAPL body?
Read More

Assessing the completeness of an exposure pathway will help the investigator prioritize actions related to LNAPL characterization and corrective action.

How is the answer informed by the below categories? Read More

  • Site setting, current and future land use, potential receptors

Receptors may be broadly defined as persons, structures, utilities, surface waters, water supply wells, and sensitive environments that are adversely affected by a release under current conditions, or that could be adversely affected under future conditions (ASTM 2015). It is recommended that long-term land use within the area of actual or potential impact be considered in assessing exposure pathways under future conditions.

  • LNAPL release details (location, timing, volume)

Details about the timing and extent of the LNAPL release can be useful for understanding the LNAPL body stability. Read More

  • Site geology and hydrogeology

An understanding of the maximum extent of dissolved and vapor phase plumes is important for analyzing the exposure pathway. If LNAPL is present at mobile saturations, the potential exists for further LNAPL migration. If NSZD rates are not greater than the LNAPL mass flux from the source, then migration may occur.

  • Natural degradation processes

Natural degradation processes are often central to understanding whether contaminants can migrate from the source to an exposure point. For example, sufficient dissolved phase plume characterization will often demonstrate the plumes are at a steady-state or declining status by virtue of natural attenuation processes, and therefore will not migrate to distal exposure points. Analysis of soil gas samples and/or comparison with screening distances can demonstrate whether bioattenuation will prevent sources of soil vapor from impacting overlying structures.

What information might already exist about a site that would help answer this question? Read More

Some LNAPL release sites come into the corrective action process because of concerns such as impacts to private water wells or sheen discharge to surface water. In these cases, it is important to focus the initial site assessment on the confirmation or refutation of complete exposure pathways because of specific LNAPL sources.

What is the minimum information that might answer this question and what would that simple LCSM look like? Read More

For an exposure pathway to be complete, the following five exposure elements must be in place: 1) contaminant source or release, 2) migration through an environmental medium, 3) contaminant presence at an exposure point, 4) route of receptor exposure, and 5) potentially exposed receptor population (ATSDR 2005). These are the minimum aspects of the LCSM that must be understood to identify concerns and develop corrective action objectives.

What are more detailed data that might answer this question and what would that more complex LCSM look like? Read More

The existence of a complete exposure pathway does not necessarily equate to an unacceptable risk that requires corrective action. In these cases, additional data may be required to understand the significance of the exposure and the resulting health risks.

What additional data is appropriate for the next steps in the evolution of the LCSM (i.e., remedy selection LCSM, remedy performance LCSM)? Read More

If receptor assumptions should change during the course of the remedy or after remedy completion, the LCSM and remedy protectiveness may need reevaluation.

9. Is the LNAPL body stable? ▼Read more


What will this tell me about the LNAPL body? Read More

An evaluation of LNAPL stability can provide key information for understanding potential risks and assessing LNAPL management alternatives. Demonstrating that an LNAPL body is stable and no longer expanding ensures that new risks will not occur in the future as the result of LNAPL migration into new areas. Determining whether there is potential for future expansion of the LNAPL body may be critical when assessing the need for a mass control remedy, or evaluating the potential effects of turning off an existing recovery or mass control system.

LNAPL stability is typically evaluated using multiple, complimentary lines of evidence, where agreement between multiple methods builds confidence in the conclusion. Examples of LNAPL stability lines of evidence highlighting key data requirements, relative weighting, and a brief summary of cautions for each line of evidence are presented in Table 4-1.

How is the answer informed by the below categories? Read More

  • Site setting, current and future land use, potential receptors

Facility operational history can give an indication of stability. Sites that have been inactive for several years with complete petroleum storage removal are less likely to exhibit migration because any release would be historical in nature. Assessing LNAPL stability provides a basis for evaluating potential exposure pathways under current and future land use conditions. If LNAPL and associated vapor and/or dissolved phase plumes are stable and do not present unacceptable risks under current conditions, then unacceptable risks in the future are unlikely under current hydrogeologic conditions.

  • LNAPL release details (location, timing, volume)

Knowledge of LNAPL release location, type, volume, age, and duration often provides useful information to support interpretation of LNAPL distribution and stability. The release point location relative to the position of the leading edge or the LNAPL body’s center of mass, along with the release duration, can be utilized to place reasonable bounds on LNAPL migration history. Additionally, the time elapsed since the release provides a useful, qualitative line of evidence when assessing LNAPL stability, as LNAPL bodies originating from older releases are more likely to be stable than more recent releases because of dissipation of LNAPL head over time, smearing of LNAPL to residual levels, and mass depletion through remediation and/or NSZD processes.

  • Site geology and hydrogeology

Site geology and hydrogeology influence how LNAPL and other fluids behave upon being released to the subsurface.

  • LNAPL body spatial distribution/extent

Mapping of the current and historical distribution of LNAPL, permeable zones, and stratigraphy can provide direct evidence of recent and/or historical LNAPL body expansion. The distribution of LNAPL can be evaluated using multiple data types, including visual observations from current and historical soil borings, fluid level gauging data, laser-induced fluorescence results, and laboratory analytical soil data.

  • Dissolved phase plume characterization

Temporal trends in dissolved phase concentrations of LNAPL constituents can be evaluated to infer LNAPL body extent over time when compared to effective solubility values. Additionally, dissolved phase trends can be evaluated statistically to infer LNAPL body stability. A stable or contracting dissolved phase plume suggests a stable or contracting LNAPL body. Table 4-1 provides additional detail on the use of dissolved phase plume stability data as a line of evidence for inferring LNAPL body stability.

  • LNAPL type, composition, physical properties

LNAPL composition and weathering patterns over time can be used to verify release sources. LNAPL density and viscosity are fundamental to calculations involving LNAPL conductivity/velocity potential, while knowledge of fluid interfacial tensions provide data that can be used to evaluate LNAPL pore entry pressures.

  • LNAPL mobility

The lack of mobile LNAPL (i.e., accumulations in wells) or LNAPL at low transmissivity values are indications that the majority of the LNAPL is at or close to residual saturation. This is a qualitative measure of plume stability. LNAPL transmissivity is best applied towards plume stability when combined with NSZD loss rates and gradient (see below).

  • Natural degradation processes

LNAPL losses through NSZD processes act to limit LNAPL flux from the interior of an LNAPL body. At some threshold, NSZD rates will match or exceed rates of lateral expansion and the LNAPL body will stabilize and/or contract. Quantification of LNAPL loss rates through NSZD processes can be evaluated in conjunction with LNAPL flux toward the leading edge of the LNAPL body using a mass balance approach to evaluate LNAPL stability (Mahler, Sale, and Lyverse 2012). Table 4-1 provides additional detail on the use of NSZD results as a line of evidence for inferring LNAPL stability.

What information might already exist about a site that would help answer this question? Read More

Data collected during routine monitoring activities near the leading edge of an LNAPL body, (e.g., well gauging and dissolved phase concentration data) are often available at existing sites. These data, assuming adequate spatial coverage and sufficient temporal data density, provide direct field observations of LNAPL migration/stability. Table 4-1 provides examples of the use of temporal trends in well gauging and dissolved phase concentration data as lines of evidence for assessing LNAPL stability. Additionally, a boring log from an existing monitoring wells (MW) that indicates past LNAPL presence (e.g., soil staining), but currently contains no in-well LNAPL is useful evidence of NSZD.

What is the minimum information that might answer this question and what would that simple LCSM look like? Read More

Table 4-1 presents common lines of evidence used to assess LNAPL stability. Typically three or more of these lines provide sufficient evidence to demonstrate stability (or instability). A minimal LCSM may only include well gauging data, dissolved phase plume data, and age of release.

What are more detailed data that might answer this question and what would that more complex LCSM look like? Read More

A more detailed LCSM may include several of the lines of evidence presented in Table 4-1. Depending on the proximity of potential receptors and the significance or consequences of LNAPL migration, a more detailed assessment may include data collection at higher spatial and or temporal resolution to demonstrate stability at a scale that is commensurate with the level of detail required to support informed LNAPL management decisions.

Table 4-1. LNAPL migration lines of evidence.

View Table 4-1 in Adobe PDF format.

10. Is the mobile LNAPL hydrogeologic condition known? ▼Read more


What will this tell me about the LNAPL body?
Read More

Understanding hydrogeologic conditions that influence LNAPL mobility are important to developing a comprehensive LCSM. This includes determining whether the LNAPL is present under confined, unconfined, or perched condition as it affects the interpretation of site data (e.g., what does the in-well LNAPL thickness represent?), mobility/recoverability, and site management/remedial strategy.

How is the answer informed by the below categories? Read More

  • Site setting, current and future land use, potential receptors

Certain site conditions may have impact on flow conditions and changes to these conditions may alter LNAPL mobility. These conditions include the presence of a surface impoundment or pond, climatic influences, or even the presence of treatment systems that can alter groundwater flow patterns.

  • Site geology and hydrogeology

Question 3 discusses the importance of site geology and hydrogeology to LNAPL mobility.

What information might already exist about a site that would help answer this question? Read More

Soil boring data will provide initial information on the site lithology. If the site investigation is older, there may also be years of fluid level gauging data. In addition, release data, if available, can provide the LNAPL properties important to assessing the mobility.

What is the minimum information that might answer this question and what would that simple LCSM look like? Read More

Understanding hydrogeologic conditions that influence LNAPL mobility are important to developing an LCSM. At a minimum, this would include fluid levels over multiple years and/or seasons, lithology, and aquifer type (perched, confined, unconfined). Some basic estimated LNAPL properties may be known, either through direct measurement (e.g., viscosity and specific gravity), or based on composition of the release.

What are more detailed data that might answer this question and what would that more complex LCSM look like? Read More

More detailed data on the physical properties of the matrix such as hydraulic conductivity, grain size, residual water saturation, and capillary properties (i.e., van Genuchten, or Brooks-Corey models) representative of variations at the site may help refine understanding of the LNAPL saturation, transmissivity, velocity, and associated plume migration/dissolution. It may also be important to characterize LNAPL properties such as specific gravity, viscosity, and interfacial tension. Sufficient core and LNAPL samples may be collected and analyzed to characterize these physical properties. LNAPL baildown tests can also be a useful tool in determining matrix and LNAPL properties as well as LNAPL transmissivity (Transmissivity Appendix).

What additional data are more appropriate for the next steps in the evolution of the LCSM (i.e., remedy selection LCSM, remedy performance LCSM)? Read More

Over the course of remedy implementation, changes in groundwater elevations may impact plume migration by exposing mobile LNAPL to different stratigraphic units, and can impact groundwater flow and LNAPL flow patterns and directions. Seasonal impacts of rainfall and evaporation can induce these changes. Variations in groundwater elevations can change the extents of exposed and submerged LNAPL along the capillary fringe and impact NSZD processes. Variations in groundwater elevations may also impact groundwater velocities and LNAPL migration rates. Therefore, it is important to continue to collect and review seasonal/historical groundwater data and associated flow patterns. Time series plan view maps should be constructed to assist with this understanding.

It is also important to understand the presence of any groundwater sources and sinks. Areas of discharge to surface water bodies should be identified along with groundwater withdrawn from pumping for domestic and agricultural purposes. These features may influence LNAPL migration patterns and present receptor exposure pathways. If an area impacted by LNAPL fluctuates between unconfined, semi-confined, and/or confined, it may present unique challenges for LNAPL remediation. It is recommended that these situations be identified in the LCSM.

4.3 LNAPL Tools

Table 4.2 provides additional tools available to characterize a given component of the LCSM. Within the table, each tool typically includes a reference for the method and a brief description. The notes provide insights regarding recently improved best practices for tool selection at sites. It is the intent of this guide to identify available tools and provide an improved understanding of their use where existing standards or literature is not available or an update is needed.

Table 4-2. LNAPL tools for characterizing LCSM components.

View Table 4-2  in Adobe PDF format.

4.4 Remedy Selection LCSM

The Remedy Selection LCSM is utilized to support selection of a remedial technology(ies) and/or controls by characterizing aspects of the LNAPL and site subsurface relative to the potentially employed remedial mechanisms. Update the Initial LCSM (e.g., by pilot testing or detailed/spot assessment) to confirm the site is adequately characterized to screen technologies to address concerns.

The questions described in this section were designed to guide an investigator through the key components of developing the technology evaluation portion of the LCSM. This represents the middle steps shown in Figure 4-1 which seek to review the Initial LCSM and remediation objectives and select the most appropriate means for LNAPL remediation or control. While there are many questions that can be answered for a site, not all are necessarily relevant or required depending on the level of detail required for the LCSM. The questions in this section are widely applicable to LNAPL sites as they generally have to be answered to develop the LCSM for understanding concerns, risks, and LNAPL source distribution—from the most general (green) to more LNAPL specific concepts (brown). Note that the discussion of the questions below are applicable to unconsolidated, bedrock and karst; however, further detail on LNAPL occurrence in fractured rock is provided in the Fractured Rock Appendix.

1. Where is the source mass? ▼Read more

The goal of this question is to understand how the water table, subsurface geology, preferential pathways, and the LNAPL distribution (mobile vs. residual) will affect the application of a technology.

    A. Homogeneous Permeable Soil ▼Read more

Multiple technologies are effective in homogeneous higher permeability soils. The primary improved LCSM would rely on further understanding the residual versus mobile fractions and distribution relative to the water table to ensure optimal remedial technology selection. The use of high resolution approaches—core photography, cone penetrometer tool, hydraulic profiling tool, or detailed visual soil boring logs—have revised several conceptual models where prior soil boring data did not give sufficient credit to variability that was significant for LNAPL source zone behavior. Thin seams of fine-grained layers that separate sand layers that can also behave as competent confining layers may be missed in less detailed visual soil boring logs and electrical conductivity logs.

    B. Interbedded Soil ▼Read more

In the event of concerns that require remediation and careful evaluation of the source distribution relative to the finer grained layers and more permeable layers, it is important to recognize that most technologies will be focused on the more permeable zones and have less influence on the finer grained layers. Note that sand layers and gravel layers can exhibit permeability values varying over three orders of magnitude. Understanding the distribution of more permeable layers relative to LNAPL impacts and connectivity will ensure that the remedial design will target the correct intervals. High-resolution approaches for both the LNAPL and soil profile are critical to identifying heterogeneity in the source area.

    C. Within low permeability media, secondary porosity, fractures ▼Read more

The lower the permeability, the more difficult it is to reduce the LNAPL source mass. LNAPL in fine-grained media often occurs in macro pores or secondary porosity when considering unconsolidated sites. The small pore spaces of the primary pore matrix, combined with sufficient moisture content, result in a large barrier to LNAPL migration; however, secondary porosity features can transport LNAPL vertically or horizontally more easily. The presence of confined or perched conditions should also be considered. High-resolution approaches may be worthwhile, but in many cases cannot substitute for detailed visual logging and core photography because secondary porosity in unconsolidated materials is not necessarily detectable by a cone penetrometer tool, a hydraulic profiling tool, or electrical conductivity.

    D. Is the LNAPL source distributed above or below the water table? ▼Read more

Characterizing the distribution of LNAPL sources relative to the water table ensures that the source of vapor and/or dissolved phase risks is properly identified.

Combining the hydraulic profiling tool or cone penetrometer tool with LIF can give a good overall picture of LNAPL distribution or a detailed look at a single boring with respect to the water table (see Figures 4-3 and 4-6). This is particularly important in confined LNAPL situations, where a remedy (e.g., SVE) may erroneously be applied opposite the confining layer (correlated to the top of the gauged thickness interval) instead of targeting the lower sand that is the actual source of LNAPL.

Figure 4-3. Cross-section using soil profiles with LIF.

The cross-section in Figure 4-3 illustrates that the gauged LNAPL thickness in MW-2 rises into the overlying clay is misleading due to confined conditions. The LIF more accurately identifies that the majority of impacts are in the sandy confined aquifer. Similarly, the LNAPL near well MW-1 in the center, while near a topographic high in the sand, is likely confined although shallow impacts within the finer grained layers will likely remain post-treatment of the sand. The data shown in Figure 4-3 identifies the distribution of LNAPL more accurately and demonstrates why gauged LNAPL thicknesses are misleading where confining conditions are present. Any required remediation at this site would need to consider multiple soil types and saturated zone treatment. This site was granted closure with no further action based on exhibited low LNAPL transmissivity values, gauged LNAPL thicknesses that were indicative of confining conditions, non-recoverability of LNAPL, and a stable dissolved phase plume with no receptors.

Evaluating LNAPL distribution goes beyond determining a bulk TPH concentration or LNAPL measurements since a historical release may have exhibited different natural weathering/biodegradation rates above and below the water table. More complex sites may benefit from more detailed soil analysis to identify specific zones that are higher in COC concern, such as BTEX.

Gauged LNAPL thickness in monitoring wells has often been a prioritized piece of data for LNAPL sources zone identification and remedial decision making. Gauged LNAPL thickness is easy to conceptualize and can be frequently monitored. As a result, technologies have often been focused on the mobile LNAPL via hydraulic recovery. Mobile LNAPL can generally be well characterized as utilizing gauging data representative of equilibrium conditions combined with subsurface geologic characterization. A comprehensive approach to identifying residual and mobile source areas allows a practitioner to better target remediation to achieve remedial goals and provide context on the effectiveness of LNAPL recovery. Characterization techniques for both the mobile and residual source zone have improved. Mobile LNAPL is now understood to exist in unconfined, confined, and perched states, as well as in secondary porosity. Residual smear zones are difficult or costly to routinely monitor over time although there are screening approaches (See Table 3-2, e.g., PID, visual observations, temporal evaluation, or vapor and/or dissolved phase indicators) as well as more definitive approaches (e.g., LIF, shake tests, TPH analysis) for soil borings that can be used for characterization and delineation.

2. What is the nature of the source? ▼Read more

This question considers the chemical nature of the source LNAPL relative to the available remedial mechanism. The prior question primarily addressed the physical nature of the LNAPL and source removal via extraction. An alternate aspect of LNAPL remedial technologies relates to the chemical nature of the LNAPL and its mobility where the highest potential removal rates may be through a hydraulic gradient, a vapor removal mechanism, solubilization, or biodegradation, and taking into account the limits of these mechanisms. These questions may be too detailed if excavation is the presumptive remedy and alternate details may be required if surfactant flushing or steam is the recommended approach.

    A. Volatile and/or Soluble ▼Read more


Is the LNAPL source volatile and/or soluble?

Where a remedial technology encourages in situ destruction or removal of a hydrocarbon constituent via induced partitioning, the chemical nature of the LNAPL affects remedial performance. As discussed in Section 3.2, the concentration of a constituent in LNAPL is directly related to its vapor or dissolved concentration as described by Raoult’s Law. Therefore, if soil vapor extraction is being used, its efficacy can be forecasted using the LNAPL composition. Figure 4-4 provides an example composition of regular grade gasoline as it evaporates. The data illustrate that after 95% of the mass has evaporated, primarily 1,2,4 trimethylbenzene through naphthalene remain. The textbook vapor pressure of 1,2,4 trimethylbenzene and naphthalene at 37 degrees Celsius is near or less than 0.12 pounds per square inch (psi). In contrast, the vapor pressure of gasoline is typically 7.8 to 13.5 psi at similar temperature and pressure. Thus, the efficacy of volatilization to remove 1,2,4 trimethylbenzene and naphthalene is reduced by two orders of magnitude.

Naphthalene and trimethylbenzene compounds are biodegradable, which may make it worthwhile to also evaluate the biodegradation potential in order to estimate a technology like biosparging or bioventing to achieve further degradation of the gasoline.

Figure 4-4. Gas chromatogram data chart (left) and simplified LNAPL composition bar chart (Right) illustrate change in LNAPL composition with increasing evaporation (Figure from (Schmidt, Beckmann, and Torkelson 2003)).

    B. Biodegradable ▼Read more


What is the efficacy of biodegradation?

Figure 4-5 represents the remedial performance of LNAPL recovery, vapor recovery, and biodegradation from a multi-phase extraction system. Overall biodegradation was the dominant component. LNAPL recovery was the least efficient, although initially LNAPL appeared to be the most promising.

Figure 4-5. Remedial rate data from a multi-phase extraction system operating at a site with gasoline range LNAPL (unrefined product).

Characterizing the extent of LNAPL transmissivity, biodegradation rate, and vapor removal rates spatially, as well as at individual points, can help forecast longevity of a given mechanism. In this case, LNAPL recovery may not have been required and more resources could have been applied towards the biodegradation mechanism if additional up-gradient investigation had been performed. The LNAPL recovery decision here was based on mobile LNAPL in the recovery wells with no up-gradient testing of LNAPL transmissivity.

For sites with LNAPL occurrence and risk-based concerns, there are technologies that can potentially address both types of concerns.

Figure 4-6. Hydrograph with well screen, LIF, hydraulic conductivity log, and soil profile (from cone penetrometer tool).

    C. Mobile vs. Residual Fractions ▼Read more


What are the fractions of mobile and residual LNAPL?

Due to heterogeneity in the subsurface, it can be difficult to quantify the residual and mobile fractions within 10 percent of the actual value. However, improved investigation tools do allow for more gross estimates, which are often sufficient to identify when residual dominates the source area, and when it is worthwhile to reduce the mobile fraction. Understanding these fractions improves the technology selection and allows the practitioner to evaluate the value of generating additional groundwater waste during mobile LNAPL recovery or if vapor enhanced recovery is preferred. Where residual LNAPL dominates, it may be preferable to focus resources towards the residual or both the mobile and residual fractions.

The data in Figure 4-6 illustrates that measurable LNAPL thickness can exist for potentiometric surface elevations below approximately 403 feet. If only this fact is considered for LNAPL source removal (i.e., skimming), the 35 feet of LNAPL identified below the water table by the LIF would be missed by the remedy, resulting in continued risk and an increased time to achieve remediation objectives.

When considering how to estimate the mobile and residual fractions shown in Figure 4-6, a variety of methods exist. While analytical soil TPH results above, at, and below the water table will give a good indication of relative fractions, this method can be costly.

Another line of evidence utilizes LNAPL transmissivity. LNAPL transmissivity values at this site are in the range of 0.1 to 0.8 ft2/day indicating that the majority of mass at the site is residual.

Seasonal fluctuations can affect the mobility of the LNAPL as well as distribution relative to the water table. Seasonal low water tables for unconfined sandy settings can result in submerged LNAPL becoming mobile. Quantification of this seasonality will help understand if recovering in low water level periods is beneficial to achieve remedial goals. Additionally, vapor removal and biodegradation rates for soil vapor extraction and bioventing have been observed to increase during seasonal water table lows. Understanding the period of improved availability and magnitude of improved LNAPL remediation rates is important to evaluating if a change in remedial approach due to seasonal differences is needed. The API NSZD Guidance (API 2017) encourages seasonal measurement of passive biodegradation mechanisms via NSZD rate measurement to understand this mechanism more fully and the benefits to site remedial goals.

3. What is achievable for a given technology? ▼Read more

Knowing the limitations of a technology and what LNAPL fractions will remain when that limit is reached helps to set expectations for remedial outcomes and whether additional technologies are needed.

    A. Mobility Based Limit ▼Read more


What is the mobility based limit?

LNAPL recovery theoretically can remove the entire mobile fraction of LNAPL, which results in a limit at residual LNAPL saturation or zero LNAPL transmissivity. However, the asymptotic nature of LNAPL recovery results in a higher limit of LNAPL recovery, representing 0.1 to 0.8 ft2/day LNAPL transmissivity. At this point, the majority of LNAPL is residual and LNAPL recovery will not continue to meaningfully reduce the source mass.

    B. Volatility Based Limit ▼Read more


What is the volatilization based limit?

Volatilization remedial mechanisms typically address compounds with lower carbon numbers than C10 (i.e., the gasoline range lighter than and including naphthalene). However, data in Figure 4-4, combined with vapor pressure data, indicate that a reduction in mass reduces the volatilization rate of the weathered fraction compared to fresh gasoline. Additional reductions through volatilization may require extended timeframes with little improvement. While volatilization does address both mobile and residual LNAPL above and below the water table, an alternate limit on the application may be the background biodegradation rate or other removal mechanisms.

    C. Solubility Based Limit ▼Read more


What is the solubilization based limit?

ISCO and co-solvent flushing would have limited effect when used alone on less soluble hydrocarbons. LNAPL analytical data, combined with the distribution of LNAPL, are often sufficient to illustrate that while these technologies may remove mass or further mobilize it for recovery, the costs limits and/or waste management for surfactants often result in these technologies not being selected.

    D. Biodegradability Based Limit ▼Read more


What is the biodegradation based limit?

Biodegradation is not limited to the light end of the carbon range like solubility or volatility. Biodegradation occurs regardless of carbon number and is more targeted towards molecular structure. Alkanes across a wide range of carbon numbers (i.e., light ends to longer chain alkanes in the C40 range) are biodegradable. However, branched alkanes or isoprenoids, asphaltenes, are less easily biodegraded. Variability also occurs due to aerobic and anaerobic degradation processes. Enhanced biodegradation limits are often defined by the magnitude of enhancement versus background degradation rates, as well as comparison to other remedial mechanisms.

Whether the technology focuses on liquid recovery, removal of volatiles, or biodegradation, there are limitations; performance will be dependent on the nature of the hydrocarbon and other physical site characteristics. Technology endpoints are often defined while considering site-specific physical obstructions, background degradation rates, and the nature of the LNAPL impacts. Qualitative methods available to help indicate relative performance rates are outlined in Table 4-3.

Table 4-3. Qualitative methods to indicate relative performance rates

Remedial Mechanism Method
LNAPL Recovery
  • 3D source and soil characterization
  • LNAPL transmissivity values as compared to 0.1 to 0.8 ft2/day range
  • Mobile vs. Residual fraction estimates
Vapor Removal Potential
  • Site setting knowledge
  • 3D source and soil characterization
  • Field headspace screening
  • LNAPL analytical characterization
  • Pilot testing
Biodegradation
  • NSZD rates represent lower bound for biodegradation
  • Single well in field respiration testing to represent aerobic potential
  • LNAPL analytical characterization
Thermal (resistive, radio wave, etc.)
  • 3D source and soil characterization
  • LNAPL analytical characterization
ISCO, Surfactant
  • 3D source and soil characterization
  • LNAPL analytical characterization

Quantified estimates of remedial performance can be completed via pilot testing, additional field characterization and/or modeling. Table 4-4 provides a list of models or analytical methods for evaluating various technology aspects. The accuracy of these estimates is often dependent on the input accuracy and site variability.

Table 4-4. Analytical methods for evaluating technologies

Mechanism or Technology to Estimate Applicable Technologies Reference Document(s)
Diffusive vapor flux NSZD, background rate for sparging or vapor extraction
  • API 4784 (API 2017)
Advective vapor flux SVE, Bioventing
  • ASTM E2531 – Appendix X (ASTM 2014b)
  • USACE (USAEC 2002)
Respiration Rates Bioventing, Soil Vapor Extraction, Air Sparging, NSZD
  • AFCEE (AFCEE 2004)
  • USACE (USAEC 2002)
  • EPA (EPA 1995)
Natural Source Zone Depletion Rates NSZD, potential lower bound for aerobic technologies (SVE, Air Sparging, Bioventing)
  • API 4784 (API 2017)
  • Vadose Zone Biodegradation Loss model, VZBL (Wilson, Hers, and Jourabchi 2016)
LNAPL Transmissivity LNAPL Recovery Technologies
  • API 4729 (API 2003)
  • API 4762 (API 2016)
  • ASTM E2856-13 (ASTM 2013)
Hydraulic control and injection Mass Control
  • Modflow – USGS
  • Visual AEM University of Waterloo
Vapor Model See ITRC PVI guidance
  • (ITRC 2014)
image_pdfPrint this page/section


LNAPL Update

web document
glossaryLNAPL Update Glossary
referencesLNAPL Update References
acronymsLNAPL Update Acronyms

ITRC
Contact Us
About ITRC
Visit ITRC
social media iconsClick here to visit ITRC on FacebookClick here to visit ITRC on TwitterClick here to visit ITRC on LinkedInITRC on Social Media
about_itrc
Permission is granted to refer to or quote from this publication with the customary acknowledgment of the source (see suggested citation and disclaimer). This web site is owned by ITRC • 1250 H Street, NW • Suite 850 • Washington, DC 20005 • (202) 266-4933 • Email: [email protected] • Terms of Service, Privacy Policy, and Usage Policy ITRC is sponsored by the Environmental Council of the States.