Appendix C – Transmissivity (Tn) Appendix
1. Introduction
In the simplest terms, LNAPL transmissivity (Tn) quantifies the rate that LNAPL can be pumped from a well. LNAPL transmissivity can readily be measured and compared to a threshold standard established by regulatory authority or site stakeholders. However, as discussed in this appendix, there is a broader spectrum of uses for LNAPL transmissivity: planning for LNAPL recovery pilot tests, optimizing and tracking LNAPL recovery remedies, designing LNAPL recovery systems, and making a case for compliance with policy requirements for LNAPL recovery to the maximum extent practicable.
LNAPL transmissivity describes the capacity of aquifer materials to transmit LNAPL. It is analogous to groundwater or aquifer transmissivity and is expressed in units of square length over time, which represents the flowrate of LNAPL through a unit width of aquifer under a unit gradient.
T=Q/(w•i)
Where:
T = LNAPL transmissivity, L^2/T
Q = LNAPL flow rate, L^3/T
W = unit width of aquifer, L
i = LNAPL gradient, L/L
Top Three Things to Know about LNAPL Transmissivity (Tn)
|
A key difference as compared to the basic concept of groundwater transmissivity is that LNAPL moves in a multiphase (LNAPL, groundwater, and soil gas) flow regimes and, therefore, LNAPL transmissivity is a function of the LNAPL saturation and relative permeability of porous media to LNAPL flow. Groundwater transmissivity is also affected by the presence of LNAPL and is a function of the water and LNAPL saturation and the relative permeability of the porous media to groundwater flow. LNAPL transmissivity is not an intrinsic property of the media alone, but also depends on the multiphase conditions and the properties of the LNAPL.
LNAPL recoverability is not directly proportional to the thickness of LNAPL that accumulates in a well (Kirkman, Adamski, and Hawthorne 2013). However, LNAPL recoverability is directly proportional to LNAPL transmissivity. Therefore, LNAPL transmissivity can be used as a threshold metric to evaluate LNAPL migration concerns or a performance metric for LNAPL recovery evaluation.
Historical and recent research substantiates the use of LNAPL transmissivity as a reliable indicator of LNAPL recovery potential [(Kolhatkar et al. 1999); (Lundy and Zimmerman 1996); (Kirkman 2013); (ASTM 2013); (API 2016); (Palmier et al. 2000)]. This research identifies the theory that underpins LNAPL transmissivity and how data analysis practices have evolved over time [(Lundy and Zimmerman 1996); (Huntley 2000); (Kirkman 2013)] as well as model and field validation of various methodologies (Kolhatkar et al. 1999) and (Palmier et al. 2000).
1.1 LNAPL Transmissivity Application
LNAPL transmissivity was initially used in the 1990s to evaluate hydraulic recovery of LNAPL (Lundy and Zimmerman 1996); (Kolhatkar et al. 1999). Since that time LNAPL transmissivity has been applied throughout the life cycle of LNAPL projects. Some examples of the broader use of LNAPL transmissivity are:
- LNAPL CSM: During development of the LNAPL conceptual site model, existing information on transmissivity and related parameters should be reviewed, and LNAPL transmissivity can be used as one line of evidence to evaluate LNAPL migration concerns.
- Pilot Testing: LNAPL transmissivity measurements can be used to plan pilot tests. Depending on scale and type of test, the LNAPL transmissivity measurements on their own may be considered a pilot test of LNAPL recovery.
- Technology Selection and Design: The results of LNAPL transmissivity testing can be used to guide selection of remediation technology, determine equipment sizing, and establish appropriate recovery well density.
- Remedy Optimization and Progress Tracking: LNAPL transmissivity may be used to track and optimize remediation, identify areas to focus remediation, and estimate remediation timelines.
- Technology Threshold Metric: An LNAPL transmissivity between the range of 0.1 to 0.8 ft2/day may be used as a decision point for remedial system operation or technology transitions.
- Defining maximum extent practicable (MEP): LNAPL transmissivity can be an indication of whether an MEP endpoint has been reached and may be interpreted within a framework that includes other complementary metrics. Section 1.2 discusses this further.
While LNAPL transmissivity is useful for evaluating LNAPL hydraulic recovery potential, it should not be used as a sole means to determine whether an LNAPL remedy for a site is necessary or unnecessary. LNAPL transmissivity does not characterize LNAPL composition concerns (e.g., human health or environmental risk as defined by RBCA ASTM and regulatory programs developed for sorbed, dissolved and vapor phase chemicals of concern). Another constraint is that LNAPL transmissivity is useful as part of an overall LNAPL plume stability evaluation, but a low transmissivity condition does not eliminate potential for sheen generation to a nearby surface water body. The decision on whether to implement an LNAPL remedial action should be based on the broader site LNAPL CSM rather than LNAPL transmissivity alone.
If a decision has been made to pursue LNAPL recovery, LNAPL transmissivity is one of several metrics that can be used to evaluate remediation technology performance. Site conditions and remediation stage dictate whether LNAPL hydraulic recovery, vapor extraction (if applicable), or biodegradation are the dominant mass removal mechanisms. Calculation of mass removal rates using common units (e.g., gallons per acre per year removed) facilitates removal mechanism comparison.
If LNAPL mass recovery is ongoing, LNAPL transmissivity can provide a metric to understand remedy progress and define the point at which hydraulic LNAPL recovery is no longer beneficial. LNAPL transmissivity directly varies with LNAPL saturation and thus offers a direct measure of the effect of LNAPL recovery on mobile LNAPL. LNAPL transmissivity measures the recoverability of the mobile LNAPL present and provides a metric to measure progress towards residual saturation (defined by zero LNAPL transmissivity). A threshold LNAPL transmissivity value, typically representative of an LNAPL saturation that is nominally above the residual LNAPL saturation for the formation, may be established at the outset of the LNAPL recovery action and used as a trigger for stopping LNAPL recovery. This can be useful as an optimization strategy to discontinue LNAPL recovery from wells or trenches where little recoverable LNAPL is present and focus recovery efforts on locations with higher transmissivity and more recoverable LNAPL.
It should be noted that LNAPL transmissivity measurements often vary in both space and time. For example, groundwater fluctuations can occur such that the LNAPL fluctuates from unconfined to confined conditions. In that situation, it may be necessary to measure LNAPL transmissivity values under both conditions. Repeated LNAPL transmissivity measurements may produce consistent values or result in extremes for some sites. In the case of extremes, spatial and temporal averaging of LNAPL transmissivity values can produce a more reliable understanding of LNAPL recoverability for use in site decision making.
The LNAPL transmissivity testing and estimation methods presented in the following sections provide a well-established framework to evaluate transmissivity for a wide variety of site conditions. This testing framework has been expanded based on recent experience to properly select and scale the testing and analysis to an individual site. Discussions of specific scenarios have been provided to support application and considerations of LNAPL transmissivity.
1.2 Maximum Extent Practicable
The United States federal government set an expectation in the Code of Federal Regulations (40 CFR 280.64 subpart F) that at underground storage tank sites where a petroleum release occurred and LNAPL is present, “owners and operators must remove free product to the maximum extent practicable as determined by the implementing agency.” The regulation further states that abatement of free product migration should be used as a minimum objective for design of an LNAPL recovery system.
State environmental regulators are typically the implementing agencies and there has been variability in state definitions of MEP. Historically, many state environmental regulatory agencies used de minimus LNAPL thicknesses, e.g., 0.01 foot, in wells as evidence of compliance with the federal MEP mandate. Some jurisdictions allow(ed) a pragmatic definition of MEP based on operation of an intensive LNAPL recovery action to the point that the remediation system was no longer producing meaningful volumes of LNAPL. This approach is effectively a site-specific, empirical definition of recovery to the MEP.
There are a number of methods that can be used individually or in combination to demonstrate compliance with the MEP requirement. These include:
- comparing mobile LNAPL mass to the mass of LNAPL in the smear zone,
- analyzing LNAPL recovery data and determining that future recovery will not be meaningful,
- showing that LNAPL thicknesses are small and/or intermittently observed,
- modeling future potential LNAPL recovery using a multiphase model,
- demonstrating that the LNAPL body is stable and that stability will not change in the future, and
- presenting information that shows an unreasonable cost per gallon or pound of LNAPL recovered.
This section is not intended to be a full discourse on MEP and but rather a discussion of how LNAPL transmissivity can be used for demonstration of compliance with MEP.
As of 2017, several state regulatory agencies have formally adopted MEP definitions that incorporate LNAPL transmissivity and many others have accepted LNAPL transmissivity in when considering remediation system shut down and site closure decisions. Colorado, Kansas, Massachusetts, Michigan, and Virginia have published technical guidance stating that LNAPL transmissivity will be considered in making decisions on the need for LNAPL recovery actions. Michigan and Kansas explicitly linked LNAPL transmissivity to their interpretation of MEP. Michigan LNAPL guidance defines MEP as “recovery of all NAPL that can be recovered in a cost effective and efficient manner”. The guidance further states that “if the NAPL has a transmissivity greater than 0.5 ft2/day, it is likely that the NAPL can be recovered in a cost-effective and efficient manner unless a demonstration is made to show otherwise.” Kansas LNAPL guidance defines MEP as “recovery of all LNAPL with a transmissivity greater than 0.8 ft2/day that can be recovered in an efficient, cost-effective manner.”
One meaningful advantage to the use of LNAPL transmissivity in determining compliance with MEP is avoiding implementing recovery actions that will not remove a meaningful amount of the source mass based on industry experience. This is useful if there is an overall objective of maximizing the environmental net benefit in relation to (often limited) remediation resources.
1.3 LNAPL transmissivity range in the 2009 ITRC LNAPL document
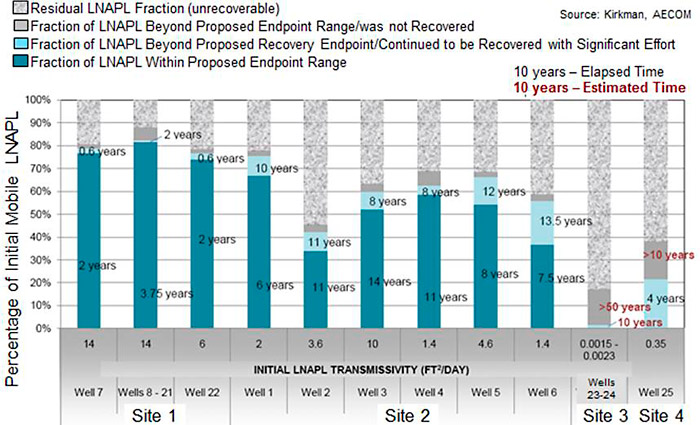
The LNAPL transmissivity range of 0.1 to 0.8 ft2/day has been referenced by many site owners and practitioners, and has been incorporated into LNAPL technical guidance by some state environmental regulatory agencies. Given the degree to which this range has been adopted by many stakeholders, the ITRC team has assembled background information on the origin of the 0.1 to 0.8 ft2/day range. The following presents conditions at the sites that were used as the basis for the range.
Site One ▼Read more
Site Two ▼Read more
Site Three ▼Read more
Site Four ▼Read more
Site Five ▼Read more
2.0 Field Methods to Measure Tn
LNAPL transmissivity is fundamentally a description of the relationship between LNAPL drawdown (or gradient) and LNAPL discharge (or flow). As such, most field test methods involve inducing an LNAPL drawdown at a well and measuring LNAPL discharge from the formation to that well. Field testing that correlates the volumetric rate of LNAPL discharge from the formation to LNAPL drawdown or the volume of water and LNAPL during pumping is the preferred way to measure LNAPL transmissivity. Both qualitative and quantitative methods for collecting and using field data to assess LNAPL transmissivity are presented in this section.
2.1 Qualitative – Recoverability
Purging LNAPL from a well and monitoring how quickly LNAPL returns to a well has been used for decades to assess LNAPL recoverability. It is intuitive that if the LNAPL returns quickly the LNAPL is more recoverable than if it recharges very slowly or does not recharge at all. It has become common to collect LNAPL recharge data over time in order to calculate LNAPL transmissivity, which is covered in the next section.
The Minnesota Pollution Control Agency (MPCA) has a structured approach to using qualitative recoverability data. The guidance provided by the MPCA states that if LNAPL in a well is purged, and less than one gallon of LNAPL recovers into the well within 24 hours; and if a repeat test shows the same recovery or lower; then LNAPL recoverability is considered low and automated LNAPL recovery methods are considered ineffective.
The MPCA approach is worthwhile for comparative behavior of LNAPL in wells. When considering a test represented by static potentiometric surface, the value of 1 gallon per day via bailing or skimming correlates well with the LNAPL transmissivity range of 0.1 to 0.8 ft2/day presented in (ITRC 2009a). Given an LNAPL transmissivity of 0.8 ft2/day and a similar skimming drawdown, 0.2 ft., as would be induced in baildown tests, the expected LNAPL recovery rate would be approximately 1.6 gallons per day. The MPCA method is useful for a broad range of sites because of the simplicity of the approach. However, it is difficult to utilize this method to project performance of an MPE or water enhanced recovery system, or for assessing LNAPL recovery performance for alternate technologies.
2.2 Quantitative – Transmissivity
Three testing methods are commonly used to measure LNAPL transmissivity. The data collection and data analysis procedures for these LNAPL transmissivity measurement methods are discussed in detail by ASTM E2856-13: ASTM Standard Guide for Estimation of LNAPL Transmissivity (ASTM 2013).
LNAPL Baildown Testing: An LNAPL baildown test is initiated by quickly removing accumulated LNAPL from a well. The rate of LNAPL flow into the well is a function of soil and LNAPL properties discussed above and the magnitude of the initial hydraulic gradient toward the well developed during LNAPL removal. The LNAPL discharge into the well is related to the LNAPL drawdown (both decrease during the test) to calculate LNAPL transmissivity. The baildown test response is influenced by prevalent fluid levels at the time of testing. Multiple baildown tests can be performed at a site to describe the range of LNAPL transmissivity values under different fluid-level conditions.
Manual LNAPL Skimming Testing: Manual LNAPL skimming tests involve repeated LNAPL recovery periods relative to baildown testing (which consists of one near-instantaneous LNAPL removal at test initiation), and thus represent a larger portion of the LNAPL-impacted formation. A manual skimming test consists of removing all LNAPL from a well, gauging the well as the LNAPL recharges, and repeatedly removing LNAPL before the recharge reaches 25 percent of pre-test LNAPL thickness. This process continues until the LNAPL removal rate stabilizes. The steady-state LNAPL discharge observed towards the end of the test is related to the induced drawdown to calculate LNAPL transmissivity.
LNAPL Recovery System Evaluation: This evaluation is commonly completed on historical LNAPL recovery system data, but it is becoming more common to configure new LNAPL recovery systems or retrofit existing LNAPL recovery systems to generate data that can be used to track LNAPL transmissivity over time. Multiple equations have been derived to calculate LNAPL transmissivity for LNAPL-only recovery, LNAPL and groundwater recovery, and multiphase (LNAPL, groundwater, and soil gas) recovery. For remedial systems operated over longer time frames, the average LNAPL volumetric recovery rate is related to the LNAPL drawdown induced by the extraction of fluids from the subsurface.
An element of the LNAPL Recovery System Evaluation approach in the ASTM guide is estimation of LNAPL transmissivity from the ratio of groundwater and LNAPL extracted from a well. This approach is easily calculated if the water drawdown induced during pumping is larger than 10 times the available LNAPL drawdown, but may also be calculated where this ratio threshold is not met (ASTM 2013). The oil/water ratio analysis can be applied to data collected during a short or long-term pumping test. A typical short-term oil/water ratio test might consist of pumping both LNAPL and water from a well for a period of several minutes to hours, with a pump intake set well below the mobile LNAPL interval, and measuring the ratio of LNAPL and water either through periodic samples or through observation of the collected liquids at the conclusion of the test. The oil/water ratio analysis can improve upon other transmissivity estimation methods when gauged LNAPL thickness is low and drawdown is similar in magnitude to gauging precision (e.g., 0.01 ft.) or where water tables exhibit frequent fluctuations such as tidally influenced cycles.
A fourth method that is less commonly performed is LNAPL Dye Trace Testing (ASTM 2013). A fluorescent dye that dissolves in petroleum but is not water soluble is added to LNAPL in a monitoring well. The dye concentration in the LNAPL in the well is measured over time and the rate of concentration decrease is used to calculate the LNAPL flux through the well. The time-averaged LNAPL transmissivity can be calculated from the LNAPL flux using site-specific data. This test is unique among transmissivity test methods because it measures LNAPL flow under ambient conditions (rather than an induced gradient); therefore, it can also be helpful for assessment of LNAPL mobility. Data collection and analysis methods for LNAPL Dye Trace Testing are also presented in the ASTM guide.
These approaches to LNAPL transmissivity measurement provide a sufficient degree of accuracy to characterize recoverability, changes in recoverability with remediation, and to calibrate models for forecasting LNAPL distribution and recovery performance. Comparative studies of multiple LNAPL transmissivity measurement techniques at the same location have shown that the different test methods generate similar results (Palmier et al. 2000); (Kirkman 2013). LNAPL recharge behavior observed during baildown tests can be used as a diagnostic to determine whether LNAPL is unconfined, perched, or confined (Kirkman, Adamski, and Hawthorne 2013). When multiple tests are conducted at different locations, the influence of geologic heterogeneity is incorporated into the transmissivity results. Field testing can also be repeated to quantify the range of LNAPL transmissivities that may be observed due to water table fluctuations increasing the overall confidence in the transmissivity data.
3.0 Data evaluation and estimation of Tn – How do you estimate Tn?
There are several methods to estimate LNAPL transmissivity. Selection of the appropriate field testing and data analysis approach is a function of how the transmissivity values will be used. A simple approximation of LNAPL transmissivity using known site parameters may be sufficient to support LCSM development for an LNAPL with small LNAPL thicknesses while a precise field-based method of determining LNAPL transmissivity would be appropriate for LNAPL model calibration at a site where LNAPL appears to be readily recoverable.
3.1 Standard methods and approaches
The ASTM Standard Guide for Estimation of LNAPL Transmissivity (ASTM E2856-13) provides data collection and data analysis procedures for estimating LNAPL transmissivity from baildown tests, manual skimming tests, LNAPL recovery system data, and LNAPL dye trace testing. API published an LNAPL Transmissivity Workbook (API Workbook) and companion user’s manual that provides a spreadsheet-based user-friendly method to calculate LNAPL transmissivity from baildown test data (API 2016). The API Workbook is consistent with the data analysis practices in ASTM E2856-13.
3.2 Simplified approaches
The transmissivity data collection and analysis methods presented in ASTM E2856-13 were designed to provide a high degree of rigor for the purpose of ensuring that the LNAPL transmissivity values measured using the ASTM method represented current best practices (ASTM 2013). It was realized that compliance with the ASTM standard cannot be consistently achieved at all sites and may not be necessary for all sites. This section describes simplified methods that can provide approximations of LNAPL transmissivity.
3.2.1 Darcy’s Law Calculation
LNAPL transmissivity can be estimated from Darcy’s Law, with a correction to the water hydraulic conductivity to account for the difference in fluid properties between the LNAPL being considered and groundwater. This approach is a theoretical exercise and it should not be expected that the result of this calculation will match field tests that measure LNAPL transmissivity. Field tests inherently account for deviations from theory and account for multiphase fluid flow. However, this calculation method may provide an estimate of LNAPL transmissivity that is useful to understand what LNAPL transmissivity may be at a site where additional field data collection is deemed unnecessary.
The data required to complete the calculation are:
Groundwater hydraulic conductivity, Kw (feet/day)
LNAPL relative permeability, krn (dimensionless)
Groundwater density, μw (grams/milliliter)
Groundwater viscosity, ρw (centipoise)
LNAPL density, ρn (grams/milliliter)
LNAPL viscosity, μn (centipoise)
The thickness of LNAPL accumulation in a well (unconfined) or the mobile LNAPL interval (confined), bn (feet)
The groundwater density and viscosity are assumed to be 1 gram/liter and 1 centipoise, respectively, at 20 degrees Celsius.
LNAPL transmissivity, Tn (feet²/day) is calculated using the following equation:
![]()
It is preferential for the data used in the calculation, with the exception of the groundwater density and viscosity, to be site-specific parameters. The LNAPL density can be determined in the field using a hydrometer or through laboratory analysis. LNAPL viscosity measurement is typically conducted in an analytical laboratory. The water hydraulic conductivity can be determined via slug testing, pump testing, or another suitable method. However, several sources provide LNAPL density and viscosity data for unweathered crude oils and refined petroleum products, and representative water hydraulic conductivities can be selected based on an understanding of the soil type where the LNAPL resides.
The simplest direct calculation of LNAPL transmissivity is based on an assumption that LNAPL fills all soil pores within the mobile LNAPL zone and where the LNAPL relative permeability is one. This calculation is considered to be conservative because LNAPL does not reach 100 percent saturation at environmental sites. This conservative calculation can be useful for sites where the LNAPL thickness is very small and field testing is neither practical nor considered necessary.
LNAPL transmissivity can also be calculated with an additional correction for the fact that LNAPL does not fill all soil pores at an environmental site (relative permeability is less than one). Within the saturated zone, LNAPL fills only a portion of the pore space. Groundwater and, in some cases, trapped gasses fill the remaining pore space. Groundwater cannot move through LNAPL-filled pores and LNAPL cannot move through groundwater-filled pores. The reduction of available pore space for liquid flow is equivalent to a decrease in the permeability of the formation. Multiphase flow calculations include a relative permeability term, which ranges from 0 to 1, to account for this decrease in soil permeability.
While a relative permeability term is useful to decrease the degree of conservativism in the Darcy’s Law calculation, there are no simple methods to estimate relative permeability without conducting field LNAPL transmissivity tests or collecting soil samples for lab analysis of petrophysical properties.
In light of this limitation, an analysis of LNAPL transmissivity data that were collected by API from member companies and compiled in a database was completed to determine a representative range of LNAPL relative permeability values. Ninety-four unique LNAPL transmissivity measurements that were entered in the database included sufficient ancillary site data to calculate relative permeability near the test well. Ninety percent of the relative permeability values were below 0.28; 80 percent were below 0.09.
The API data are provided as a potential basis for selection of a relative permeability value that represents the degree of conservatism that is appropriate for the site setting and conditions. The relative permeability may also be estimated from fluid retention models as described in API LDRM model (API 2007).
3.2.2 Bouwer and Rice Type Curves
When LNAPL discharge into a well during a baildown test does not follow ideal hydraulic response patterns, it is not possible to accurately estimate Tn using conventional methods. In these cases it may be reasonable to approximate LNAPL transmissivity through visual inspection of the recovery data versus an idealized hydraulic response. The API Workbook can be used to generate Bouwer and Rice type curves that show idealized LNAPL drawdown as a function of time. Note that a test-specific J-ratio term must be established in the workbook to support this approach. The user’s guide for the API Workbook provides direction on how to set an appropriate J-ratio.
An example of the use of the Bouwer and Rice type curves for determination of LNAPL transmissivity is shown on Figure Tn-2. In this case inspection of where the data plot on the graph indicates that the LNAPL transmissivity is between 0.002 and 0.005 meters2/day. The Bouwer and Rice analytical calculation for these data was 0.003 meters2/day. All of the data points are to the left of the 0.005 meters2/day curve and it would be accurate to state that the LNAPL transmissivity is less than 0.005 meters2/day. For a theoretical scenario where an LNAPL transmissivity threshold of greater than 0.01 meters2/day had been established for initiating LNAPL recovery, this approach would provide a high degree of certainty that the transmissivity was less than the threshold value.
While this method for determining LNAPL transmissivity is straightforward, it can produce erroneous results. (Kirkman, Adamski, and Hawthorne 2013) demonstrated that while an estimate of LNAPL transmissivity can be made via type curves, those type curves rely on an accurate identification and elimination of the initial drawdown data, which is often higher than the formation response due to filter pack recharge effects. If the filter pack recharge data are dominant within the data set, possibly due to incomplete LNAPL purging, this approach could in overestimation of LNAPL transmissivity.
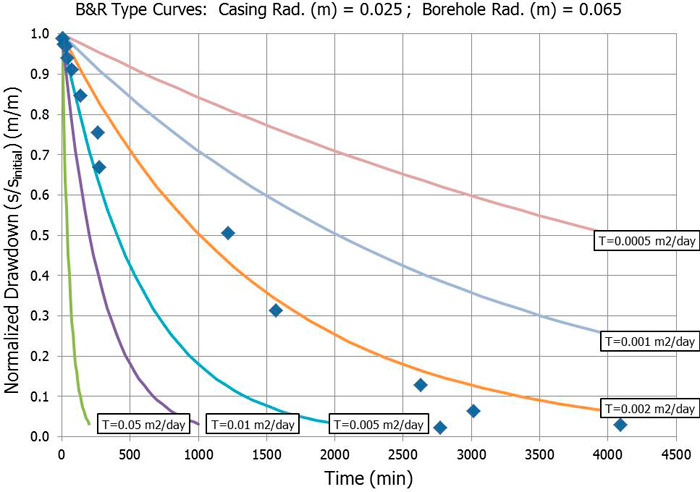
Figure Tn-2. Normalized drawdown data from a baildown test plotted with Bouwer and Rice type curves generated for the test well.
3.3 Common challenges in LNAPL Transmissivity Measurement
As LNAPL transmissivity has become more widely used and more frequently measured, several common challenges or complicating factors have emerged in transmissivity measurement. For example, at monitoring wells with small equilibrium in-well LNAPL thicknesses, LNAPL baildown testing involves significant uncertainty and is generally not recommended (ASTM 2013). A few frequently encountered challenging scenarios are summarized in the following table, along with potential solutions or suggestions to mitigate challenges.
Table Tn-1. LNAPL transmissivity measurement challenges and potential solutions
| Challenge | Potential Causes | How should field activities be adjusted to get a more reliable Tn result? |
|---|---|---|
| Fluctuating water table during testing creates uncertainty in LNAPL drawdown | Tidal fluctuations, weather-related/regional influences | Consider oil-water ratio tests (which can induce additional drawdown and reduce significance of ambient fluctuations) or qualitative measurements.
Consider using early-time data to generate an approximate or upper-bound result. |
| Slow recovery | Low Tn (associated with low LNAPL saturation, submerged NAPL, etc.);
Possibly poorly developed wells |
Consider using data to estimate an upper-bound transmissivity result, even if data appear to represent filter pack recharge only.
Evaluate data using Bouwer & Rice type curves to develop an upper-bound result. Consider redeveloping wells and re-testing, noting that significant time may be required for re-equilibration. Consider estimating maximum theoretical LNAPL transmissivity at 100% LNAPL saturation, using LNAPL viscosity data and Darcy’s Law relationships described in Section 3.2.1 of this Appendix. |
| Difficult/imprecise Fluid Level Measurements; Difficulty in Gauging | High viscosity LNAPL
Easily-emulsified LNAPL LNAPL optical properties |
For high viscosity NAPL, consider using empirical data or desktop calculations.
For emulsions or optically challenging NAPLs, consider using pressure transducers or other automated measurement solutions. Consider oil-water ratio tests where total fluids can be pumped from the test well and measured ex situ, with additional separation or settling time and/or different measurement methods. |
| Small in-well LNAPL thickness (below 0.2-0.5 ft. benchmarks for manual skimming or baildown testing in ASTM E2856-13) | Small mobile LNAPL interval in the surrounding formation
Well not yet equilibrated with larger mobile LNAPL interval |
Consider oil-water ratio tests where total fluids can be pumped from the test well and measured ex situ, with greater precision than down-well measurements.
Consider estimating maximum theoretical LNAPL transmissivity at 100% LNAPL saturation, using LNAPL viscosity data and Darcy’s Law relationships described in Section 3.2.1 of this Appendix. |
3.4 Interpreting LNAPL Transmissivity and In-well LNAPL Thickness
As LNAPL transmissivity has been more broadly adopted as a tool for site evaluation, in-well LNAPL thickness, which was historically often relied upon as an indicator of the magnitude of LNAPL impact, has generally become less significant. However, in-well LNAPL thickness and the relation to the surrounding mobile LNAPL interval in the formation is still an important component of the LNAPL conceptual site model. Additionally, the relationship of in-well LNAPL thickness to LNAPL transmissivity results can highlight important considerations or cautions related to LNAPL transmissivity and LNAPL hydrogeologic conditions.
The following table summarizes general inferences that may be drawn from relationships between LNAPL transmissivity and in-well LNAPL thicknesses.
Table Tn-2. Interpretation of LNAPL thickness and transmissivity
| In-Well LNAPL Thickness | LNAPL Transmissivity | What does this tell us? |
|---|---|---|
| High | High | Recoverability may be good; consider targeting this location if needed to reach saturation objectives. |
| Low | LNAPL may be present in a confined or perched conditions or in fine-grained soils with a small mobile LNAPL interval. The large thickness in this case is observed only because the well is present and providing hydrostatic relief. | |
| Low | High | Carefully evaluate LNAPL drawdown, which is a sensitive parameter for Tn. Measurement error for drawdown may be relatively large at small LNAPL thicknesses. Consider qualitative Tn test methods or oil-water ratio testing to reduce sensitivity to drawdown. |
| Low | Recoverability is likely low; however, as with other low-thickness conditions, confirm LNAPL drawdown is accurately measured. |
4.0 Case Studies
The following case studies were prepared to provide context on practical application of LNAPL transmissivity at LNAPL-affected sites. Case studies are presented for the following applications and topics:
- LNAPL transmissivity and recovery system design
- Averaging of LNAPL transmissivity results
- Tracking of LNAPL recovery system performance
- Assessment of LNAPL body stability
- Use of LNAPL transmissivity at small sites
4.1 LNAPL Recovery System Design
LNAPL transmissivity has direct application to recovery system design, and can be used to estimate LNAPL recovery rates and compare potential recovery approaches. The following case study of a site where LNAPL recovery was needed to reach LNAPL saturation objectives describes ways that LNAPL transmissivity data can be used for LNAPL recovery system design.
Background
The study site is a natural gas plant where a gas condensate release was identified during routine pipeline maintenance. Soil near the release area was heterogeneous with interbedded coarse-grained and fine-grained soils. Water-saturated hydraulic conductivities at the site range from 10-3 to 10-4 cm/sec, which are consistent with silty sands and fine sands. The average hydraulic gradient is 0.003 foot per foot.
LNAPL Nature and Extent
The natural gas condensate was found to be leaking from a buried pipeline. The pipeline was repaired and the there is no longer an ongoing release. The natural gas condensate has a low density (0.701 grams per cubic centimeter) and low viscosity (0.504 centistokes). The horizontal and vertical extent of LNAPL was investigated using laser-induced fluorescence, photoionization detector screening of soil cuttings, and visual observations in soil borings and monitoring wells.
LNAPL Recoverability – Initial Baildown and Manual Skimming Tests
During the initial investigation, LNAPL transmissivity testing was conducted using short-term test methods. An LNAPL baildown or manual skimming test was conducted at three monitoring wells located adjacent to the source (monitoring well (MW)-1), downgradient of the source (MW-2) and at the leading edge of the LNAPL body (MW-3). Baildown tests were attempted and failed at MW-1 and MW-2 because LNAPL recharge was rapid and exceeded the maximum flow rate of the pump used to purge LNAPL. In response to this observation, modified skimming tests were conducted. As before, the LNAPL recharge rate was rapid, and only minimal LNAPL drawdown in the well could be achieved. The initial investigation calculated that transmissivities for wells MW-1 and MW-2 were subject to a high degree of uncertainty due to the minimal drawdown. To reduce this uncertainty, and provide greater accuracy to support LNAPL recovery system design, a LNAPL pumping test was pursued.
Table Tn-3. LNAPL transmissivity results from the first attempt at measurement. gpm = gallons per minute
| Well ID | Well Location | Test Method | Measured LNAPL Thickness (ft.) | LNAPL Transmissivity (ft2/day) | Maximum LNAPL Recovery Rate (gpm) |
|---|---|---|---|---|---|
| MW-1 | Source | Manual Skimming | 8.13 | 125 – 210 | 2.1-3.6 |
| MW-2 | Mid-point | Manual Skimming | 4.39 | 60 – 95 | 0.5-0.9 |
| MW-3 | LNAPL fringe | Baildown Test | 2.2 | 1.3 | 0.003 |
LNAPL Pump Tests
A series of 10-hour LNAPL pumping tests were completed at MW-1, MW-2, and MW-3 to more accurately determine LNAPL transmissivity and sustainable LNAPL recoverability for designing interim and longer-term LNAPL recovery at the site. This longer-term test (10 hours) approximated steady state LNAPL flow to the well, resulting in a more accurate estimate of LNAPL transmissivity. LNAPL pump tests were completed in general accordance with the manual skimming protocol included in the ASTM E2856-13, with the goal of achieving a consistent LNAPL drawdown with a stable, continuous LNAPL extraction rate for the duration of the test. Based on the initial LNAPL transmissivity testing, an appropriately sized pump was selected to maintain an LNAPL thickness in the well of no greater than 25 percent of the measured thickness. Pump intakes were placed within the accumulated LNAPL, approximately 0.5 feet above the potentiometric surface, to avoid recovery of groundwater. LNAPL thickness was continuously monitored in the early stages of the test, and LNAPL pumping rates were manually adjusted to reach a stable LNAPL drawdown.
LNAPL transmissivity was calculated following Equation 16 of ASTM E2856-13 (ASTM 2013). Results for the LNAPL pump tests are summarized in Table Tn-4.
Table Tn-4. LNAPL transmissivity results from 10-hour LNAPL pumping tests
| Well ID | Total Test Time (hours) | Average LNAPL Recovery Rate (gallons/minute) | Average LNAPL Transmissivity (ft2/day) |
|---|---|---|---|
| MW-1 | 80 | 1.2 | 100 |
| MW-2 | 20 | 0.3 | 60 |
| MW-3 | 10 | 0.1 | 20 |
LNAPL Recovery Design
The results of the LNAPL transmissivity testing were used to develop an LNAPL recovery action designed to recover mass, reduce LNAPL saturation, and mitigate LNAPL migration. Results from the LNAPL transmissivity testing were incorporated into the recovery system design, and informed the recovery method, well density and location, pump and pipe sizing, and recovered LNAPL handling requirements. Because LNAPL transmissivity values vary spatially and there is significant heterogeneity at the site, short-term pump tests were conducted at each recovery well that was installed to verify potential recovery rates and design aspects. Incorporating LNAPL transmissivity prior to remediation design resulted in appropriate sizing of the remediation system, supported logistics planning, and developed baseline transmissivity values that can be used to track remedy progress.
4.2 LNAPL Transmissivity Averaging
As discussed elsewhere in this Appendix, LNAPL transmissivity is a bulk parameter representing the combined effects of multiple parameters that control the capacity of the formation to transmit LNAPL, including:
- aquifer matrix characteristics,
- LNAPL physical properties,
- the fraction of pore space occupied by LNAPL (LNAPL saturation, or relative permeability to LNAPL), and
- the vertical interval of mobile LNAPL in the formation.
The fact that LNAPL transmissivity is inclusive of each of these parameters makes it a useful metric for assessing LNAPL recoverability, as it is directly proportional to recoverability under the ambient conditions during the time of testing. However, it is important to acknowledge that the parameters affecting LNAPL transmissivity can vary temporally under certain conditions, resulting in a corresponding temporal variability of LNAPL transmissivity.
While aquifer matrix properties are typically assumed fixed, LNAPL properties and relative permeability to LNAPL often vary over time. For example, the physical properties of petroleum LNAPLs can be altered as the result of NSZD processes. These effects tend to increase the viscosity of LNAPLs, leading to a gradual decrease in LNAPL transmissivity. LNAPL saturation at a given location can also vary over time and space as the result of engineered LNAPL remediation efforts, NSZD processes, or redistribution of LNAPL through vertical and/or horizontal migration. In the early stages of LNAPL body development following a release, LNAPL saturation will increase near the leading edge of the LNAPL body and decrease in the area of the release. As LNAPL spreads into previously non-impacted formation materials, an increasing fraction of the LNAPL is trapped as a discontinuous non-wetting phase by capillary forces (becoming residual LNAPL). Thus, as the LNAPL body spreads or moves, an increasing volume of LNAPL becomes residual over time, resulting in an overall decrease in the volume of mobile LNAPL distributed over a larger volume of the subsurface.
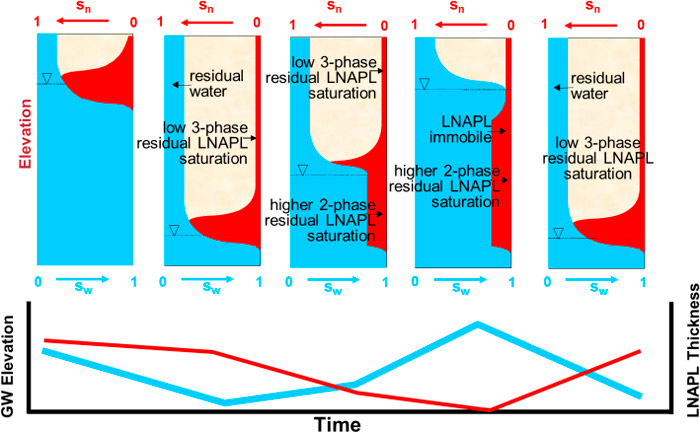
Beyond the point where lateral LNAPL migration has ceased, water table fluctuations may continue to alter the interval of mobile LNAPL in the formation. Residual LNAPL saturation is generally higher under water saturated conditions (where LNAPL and water completely fill the pore space, and LNAPL is the non-wetting fluid phase) than unsaturated conditions (where pore space is occupied by water, LNAPL, and air, and LNAPL has intermediate wettability). As a result, LNAPL can transition from residual to mobile (or vice versa) as the water table rises and falls.
Fluctuating water levels are commonly observed in response to seasonal recharge patterns, or in some cases due to tidal influences, construction dewatering, or changes in nearby groundwater pumping schedules. Where LNAPL is present in the zone of water table fluctuation, the vertical redistribution of LNAPL will result in a corresponding temporal variability in LNAPL transmissivity. The impact of water table fluctuations on LNAPL recoverability should be evaluated on a site-specific basis to determine appropriate test methods, number of locations to be tested, and frequency of testing (Kirkman 2013). Case study examples of how LNAPL transmissivity was evaluated at sites with temporal variability in LNAPL transmissivity due to water table fluctuations are provided below.
Case 1: Tidally influenced site ▼Read more
Case 2: Seasonal Variability ▼Read more
Case 3: Active Recovery System ▼Read more
4.3 LNAPL Transmissivity to Track LNAPL Recovery Progress
Short term transmissivity tests such as baildown and manual skimming tests evaluate LNAPL transmissivity by purging LNAPL from a well and observing the hydraulic response over the course of hours or days. In contrast, long-term recovery data represent sustained hydraulic recovery dynamic equilibrium conditions that reflect a larger radius of influence around a well than short-term test methods. Correspondingly, the average LNAPL transmissivity value calculated from long-term recovery data represents a larger volume of the subsurface than short-term test methods and better accounts for subsurface permeability and/or LNAPL saturation heterogeneities. Consequently, short-term testing methods are precise point measurements while long-term recovery data measurements represent more accurate large-scale measurements.
It is possible to estimate LNAPL transmissivity values from recovery data for individual wells or trenches, groups of wells or trenches, or entire hydraulic recovery systems. As LNAPL is recovered from the subsurface, the LNAPL saturation decreases and it is expected that the LNAPL transmissivity will decrease as a result. An analysis of LNAPL transmissivity over time can provide a gauge of the progress towards completion of hydraulic recovery. The benefit to using LNAPL transmissivity as compared to tracking LNAPL recovery volumes is that LNAPL transmissivity can normalize changes in system operation that may result in increased LNAPL production. For example, if the overall pumping rate for a combined groundwater and LNAPL recovery system were increased, the volumetric rate of LNAPL recovery will likewise increase. However, an oil/water ratio analysis will show that the LNAPL transmissivity did not change and may show that the increased pumping rate results in a faster decrease in LNAPL transmissivity over time compared to the lower pumping rate.
An example transmissivity evaluation for an LNAPL recovery system showing recovery progress over time is presented in Figure Tn-4. The graph shows LNAPL and groundwater recovery trends over time for an LNAPL remediation system that was operated for eight years at a rail yard. There was a steady increase in the volume of both groundwater and LNAPL recovered at the site as a result of upgrades to groundwater treatment system equipment and improved management of system and well fouling. The LNAPL recovery profile shows that LNAPL recovery peaked in 2013 as a result of these efforts. However, the LNAPL transmissivity curve shows that the LNAPL transmissivity was decreasing throughout operation of the remediation system.
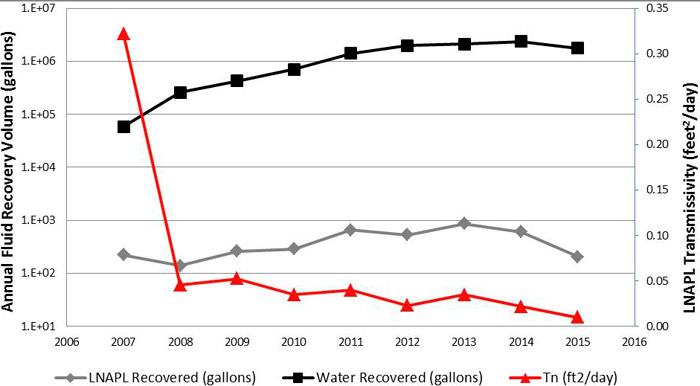
Figure Tn-4: LNAPL transmissivity and LNAPL and groundwater recovery volumes for a total fluids recovery system.
While LNAPL transmissivity is an excellent parameter to trace recovery system performance, additional lines of evidence may be useful to round out the evaluation. Complementary analyses include decline curve analysis, modeling of sustainable recovery curves, and calculation of specific LNAPL volume reductions as a result of LNAPL recovery.
Figure Tn-5 provides an empirical example of why LNAPL transmissivity is a better metric than using the thickness of LNAPL accumulation in wells for evaluating LNAPL recovery performance. The graph presents 10 years of vacuum truck recovery at an LNAPL site with little to no change in thickness as a result of recovery efforts. The dominant factor for LNAPL thicknesses illustrated by these data is the potentiometric surface elevation. If the LNAPL thickness was affected by the ongoing recovery action, a clear trend of smaller LNAPL thicknesses over time would have been observed, which would have resulted in clustering of early time data on the right side of the graph and late time data on the left.
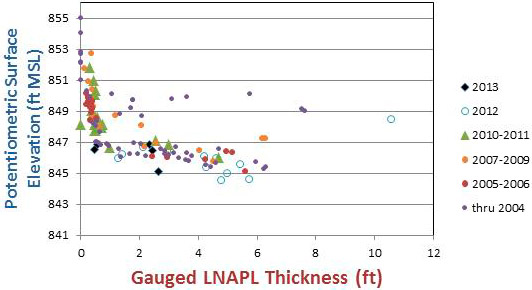
Figure Tn-5: Gauged LNAPL thickness vs. potentiometric surface elevation through time (Kirkman, Adamski, and Hawthorne 2013).
4.4 LNAPL Body Stability
LNAPL transmissivity can be used as a line of evidence to assess the overall stability and migration potential of an LNAPL body, supporting other evaluations based on time-series fluid level measurements and dissolved-phase concentration trends. Stability and migration potential are controlled by hydraulic gradients and LNAPL hydraulic conductivity, rather than the related concept of LNAPL transmissivity. LNAPL conductivity is governed by similar parameters (LNAPL saturation, LNAPL physical properties, and soil permeability), but does not incorporate the vertical thickness component of LNAPL transmissivity, making it suited to evaluate LNAPL migration potential rather than LNAPL recovery potential. LNAPL conductivity values can be calculated from transmissivity results, and it is also possible to directly measure LNAPL flux under ambient conditions through LNAPL tracer testing. An example use of transmissivity testing methods for evaluation of LNAPL body stability is provided below.
At this site, unconfined LNAPL is consistently present in three wells (MW-1, -2, and -3) within a larger residual LNAPL footprint. Each well typically contained 0.5 to 1 ft. of LNAPL under equilibrium conditions. Fluid level gauging data indicate that the mobile LNAPL footprint is consistent or decreasing in size over time, and monitoring data from downgradient wells indicate declining dissolved-phase concentration trends. LNAPL baildown tests completed at MW-1, MW-2, and MW-3 indicate the following:
- MW-1: Negligible LNAPL recharge occurred over a period of 5 days – Tn could not be well-quantified by baildown tests, but is qualitatively very low.
- MW-2: Tn of 1.5 ft2/d
- MW-3: Tn of 0.4 ft2/d
Based on these results, migration potential in the area of MW-1 was interpreted to be minimal; however, questions remained regarding the overall stability and migration potential of LNAPL in MW-2 and MW-3. To supplement the baildown test results, LNAPL dye trace tests (tracer tests) were conducted in each of the three wells containing LNAPL.
The LNAPL tracer test results indicated the following LNAPL flux over a six-month test period:
- MW-1: 0.008 ft./yr.
- MW-2: 0.9 ft./yr.
- MW-3: 0.4 ft./yr.
These data supported previous conclusions regarding MW-1, with LNAPL movement in the area of MW-1 minimal and hydraulic recovery of LNAPL at that location considered impractical. The tracer test results were used in conjunction with LNAPL hydraulic gradient measurements to calculate LNAPL transmissivity values, which were in general agreement with the previous baildown test results. The tracer test results also allowed calculation of LNAPL pore velocity, yielding:
- MW-1: 8 x 10⁻⁷ cm/s
- MW-2: 5 x 10⁻⁵ cm/s
- MW-3: 6 x 10⁻⁶ cm/s
The velocity estimates developed from tracer testing results are based on actual LNAPL flow, but do not account for NSZD mechanisms that are likely occurring around the perimeter of the LNAPL body, acting to reinforce overall LNAPL body stability. Therefore, the results should be considered a local measurement within the core of the area of mobile LNAPL, rather than a representative velocity for the LNAPL body as a whole. Flux measurements can also be combined with NSZD measurements to demonstrate overall LNAPL body stability following the approach of (Mahler, Sale, and Lyverse 2012).
Overall, review of these site data indicate that LNAPL transmissivity results correlate well to LNAPL mobility, and initial baildown test results could be used as a preliminary line of evidence to evaluate mobility and stability; however, by incorporating additional measurements and lines of evidence, including the LNAPL tracer testing method, an improved understanding of both LNAPL transmissivity and overall LNAPL body stability were developed.
4.5 Use of LNAPL Transmissivity at Small Sites
Several of the other case studies presented in this Appendix focus on aspects of LNAPL transmissivity application that are relevant to larger sites—for example, evaluation of data from large recovery systems. The following example (Figure Tn-6) presents an application of the same LNAPL transmissivity concepts to a site with a small LNAPL footprint.
The example site is a former service station and truck stop located in an area of commercial development that operated from the early 1980s through the mid-1990s. USTs previously used for storage of gasoline and diesel fuel were removed from the site in the late 1990s, and the site has been vacant since. Impacts to soil were noted during removal of a diesel UST, and a series of soil borings and monitoring wells installed in the late 1990s and early 2000s served to delineate the extent of diesel impacts in the subsurface. LNAPL accumulations were observed in as many as eight monitoring wells in an area of approximately 0.5 acres surrounding a former diesel UST.
Various LNAPL recovery technologies, including periodic removal technologies (manual bailing, vacuum truck extraction, and deployment of sorbent socks) and belt skimmers were implemented at the site from 2001 through 2005 in an attempt to reduce LNAPL thickness in wells to less than 1/8-inch, in accordance with regulatory policy. A total of approximately 500 gallons of LNAPL was recovered; however, LNAPL accumulations were still routinely observed in four monitoring wells at the site.
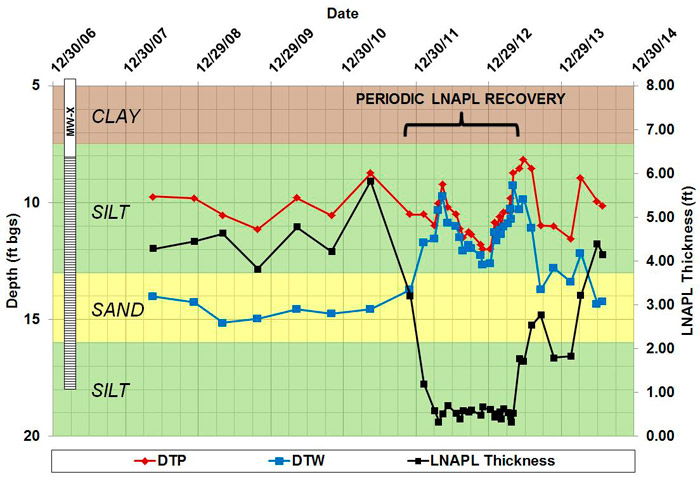
Figure Tn-6. Fluid levels and LNAPL thickness in MW-X before, during, and after periodic LNAPL recovery was conducted. DTP = Depth to Product, DTW = Depth to Groundwater.
LNAPL removal activities were temporarily halted from 2005 through 2011; however, fluid level gauging and groundwater monitoring activities continued on a biennial schedule. During this time, groundwater sampling results indicated stable to decreasing dissolved phase concentrations of TPH-D and naphthalene in wells surrounding the LNAPL source zone. This data, along with the observation that sentinel wells installed around the perimeter of the LNAPL body remained free of LNAPL, provided compelling evidence that the LNAPL body was stable and not migrating. However, LNAPL accumulations in one well (MW-X) reached a thickness of nearly six feet, which raised concerns that LNAPL migration could be occurring. Between December 2011 and August 2013, monthly LNAPL bailing was resumed in an effort to halt any potential LNAPL migration. While LNAPL thickness was maintained at approximately 0.5 ft., there was no evidence of any further progress toward the 1/8-inch criterion.
Beginning in 2013, a more informed approach to LNAPL management was adopted including LNAPL transmissivity testing, which at well MW-X was less than 0.1 ft2/d. Evaluation of historical soil boring logs and review of historical fluid level gauging data from 2008 through 2011 using up-to-date analysis approaches, such as diagnostic gauge plots, revealed that LNAPL in the vicinity of MW-X was present under confined conditions.
This finding provided an explanation for the historical LNAPL thickness trends observed at MW-X, and demonstrated that changes in LNAPL thickness had no bearing on LNAPL mobility. Other site data, including dissolved phase concentration trends and fluid level gauging data in wells located around the perimeter of the LNAPL body, provided compelling evidence that LNAPL was stable and not migrating. The low LNAPL transmissivity result at MW-X provided an additional line of evidence in support of a stable LNAPL body, and demonstrated that LNAPL recovery would not provide a meaningful reduction in LNAPL mass.

