Appendix B–Natural Source Zone Depletion (NSZD) Appendix
Executive Summary
Numerous sites across the country are impacted with light, nonaqueous-phase liquids (LNAPL). LNAPL Natural Source Zone Depletion (NSZD) occurs through the combined action of natural processes that reduce the mass of LNAPL in the subsurface. Key NSZD processes include volatilization, dissolution, and biodegradation; these processes reduce LNAPL mass, saturation, and mobility over time. NSZD rates (i.e., the rates of bulk LNAPL mass depletion) are often higher than historically acknowledged.
This document updates and supersedes earlier ITRC guidance on NSZD (ITRC 2009b), reflecting advances in the intervening years in understanding NSZD mechanisms (including direct biodegradation of LNAPL) and methods to confirm the occurrence and/or quantify the rate of NSZD. This appendix discusses key mechanisms and several frequently-used NSZD assessment methods, including:
- The gradient method, based on soil gas composition,
- Carbon dioxide flux based-methods, including CO2 traps and flux chambers, and
- The biogenic heat monitoring method.
This appendix discusses the importance of incorporating NSZD into the three stages of the LNAPL Conceptual Site Model (LCSM) development process (the Initial LCSM, Remedy Selection LCSM, and Design and Performance LCSM). NSZD is a fundamental aspect of understanding issues such as LNAPL mobility, distribution, and longevity, and thus is a key part of the Initial LCSM. In later LCSM stages, NSZD can be evaluated as a remedial alternative, with NSZD serving in one or more of the following roles:
- A baseline to evaluate the relative benefit of other technologies (e.g., by comparing an LNAPL skimming system’s removal rates to NSZD rates);
- A stand-alone remedy at sites where LNAPL-related impacts are stable, potential receptors are not at risk, and NSZD timeframes are consistent with the goals of the site owner and with regulatory requirements;
- A component of a remedy, where NSZD is primary remedy component for portions of the LNAPL zone, and engineered remediation systems are focused on those portions of the LNAPL footprint where more aggressive removal is appropriate to meet remedial goals; and
- A final step in a treatment train, where there is remedy transition to NSZD as a long-term risk management approach after other remedial technologies have achieved their design objectives.
NSZD is an underlying driver of progress toward remedial goals at almost all LNAPL sites, through reductions in LNAPL mobility and LNAPL body longevity, and changes in LNAPL composition. Research continues into developing and refining methods to confirm NSZD activity and quantify NSZD rates.
1.0 Introduction
Numerous sites across the country are impacted with light, nonaqueous-phase liquids (LNAPL). LNAPL Natural Source Zone Depletion (NSZD) occurs through the combined action of natural processes that reduce the mass of LNAPL in the subsurface. Key processes include volatilization, dissolution, and biodegradation. At LNAPL release sites where LNAPL still exists, NSZD over time depletes LNAPL mass and reduces LNAPL saturation and mobility.
This document provides a technical overview of NSZD for LNAPL and the methods by which rates can be measured. The NSZD rate, when appropriately assessed, can serve as an objective benchmark to compare the relative effectiveness of different remedial alternatives, a metric to gauge the declining performance of active remediation systems, and the basis for consideration of NSZD as a remedy. It is assumed that the NSZD evaluation process described herein is conducted within the framework of the overarching LNAPL site management process described in the main body of the ITRC report (“the parent document”).
This document reflects the tremendous advances that have occurred in understanding and measuring NSZD in the intervening years, which have resulted in a shift in the conceptualization of NSZD, moving away from an emphasis on processes exhibited through electron acceptors and lateral groundwater transport, toward a fuller appreciation of the importance of methanogenesis, direct biodegradation of LNAPL, and vadose zone transport of biogenic gases. As this new conceptual model has been embraced, it has become evident that the rate of LNAPL depletion had historically been greatly underestimated ([popuppress id=”43142″]).
1.1 LNAPL Source Zones
“LNAPL” is a term given to an organic compound that is immiscible with, and lighter than, water (e.g., crude oil, gasoline, diesel fuel, heating oil). When an LNAPL is released to the subsurface, it can migrate downward and laterally. The resulting LNAPL distribution depends on lithology and soil properties (such as grain size, porosity, and water saturation), LNAPL properties (such as viscosity), and the LNAPL release volume and head.
Small LNAPL releases may become trapped in the soil pores as an immobile, residual phase before it is able to reach the water table. Larger LNAPL releases may migrate to the water table while leaving immobile, residual LNAPL along the migration path. At the water table, LNAPL can accumulate and spread across the surface of the saturated zone in all directions, partially influenced by the direction of decreasing hydraulic gradient. The constituents, or chemicals, that compose the LNAPL may be removed over time by various mechanisms, such as sorption, volatilization, dissolution, and direct biodegradation. The LNAPL “body” can function as a potentially long-lived source of secondary impacts to adjacent soil, soil gas, and groundwater. This document refers to such an LNAPL body as a “source zone.” Figure NSZD-1 shows an example LNAPL source zone in cross section. The portion of the source zone in the unsaturated zone is referred to as the unsaturated (or exposed) source zone. The portion of the source zone in the groundwater-saturated zone or below the water table is referred to as the saturated (or submerged) source zone.
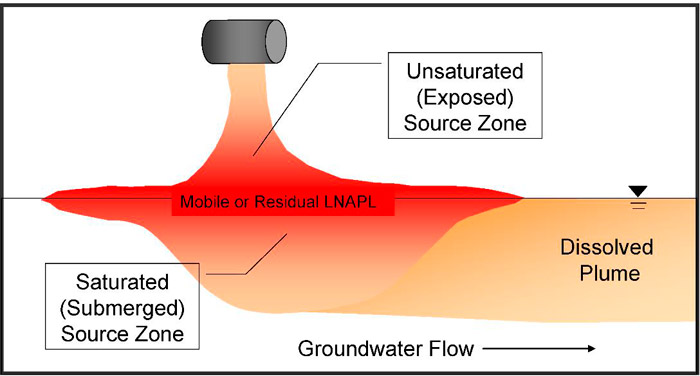
Figure NSZD-1. Example LNAPL source zone.
1.2 Natural Source Zone Depletion
The naturally occurring processes of partitioning and biodegradation result in mass loss from the LNAPL source zone. This document addresses several questions associated with NSZD:
- What are the processes involved in NSZD?
- How can the NSZD rate be measured, and what are typical NSZD rates?
- What are the long-term implications of NSZD on LNAPL source zone longevity and composition?
2.0 NSZD Processes and Theory
Once released into the subsurface, hydrocarbon constituents in LNAPL undergo various processes that reduce the total LNAPL mass. LNAPL NSZD occurs when certain processes act to (a) physically redistribute (partition) LNAPL components to the mineral, aqueous and gaseous phases and (b) biologically break down NAPL components. Specifically, these processes involve: i) sorption onto subsurface solids; ii) dissolution of LNAPL constituents into pore water; iii) volatilization of LNAPL constituents into the vadose zone; and iv) biodegradation of LNAPL constituents within the LNAPL body and adjacent vadose and saturated zones.
At the core of NSZD are the biodegradation processes described in this section. The ways that these reactions determine LNAPL fate and transport in the vadose zone and the groundwater (saturated zone) are addressed in separate subsections.
2.1 Biogeochemical Principles
The biodegradation of petroleum is an oxidation process (releases electrons). Microbes couple such electron-generating reactions to electron-accepting (reduction) reactions. Reduction reactants are known as terminal electron acceptors (TEAs). Where multiple TEAs are available in soil, thermodynamic considerations favor microbial use of the TEAs that generate more energy, starting with oxygen (Bethke et al. 2011). This concept is known as the electron acceptor ladder. This concept is illustrated in Figure NSZD-2, which shows the electron potential (pƐ), a thermodynamic property of the electron acceptors related to their ability to accept electrons (Stuum and Morgan 1981).
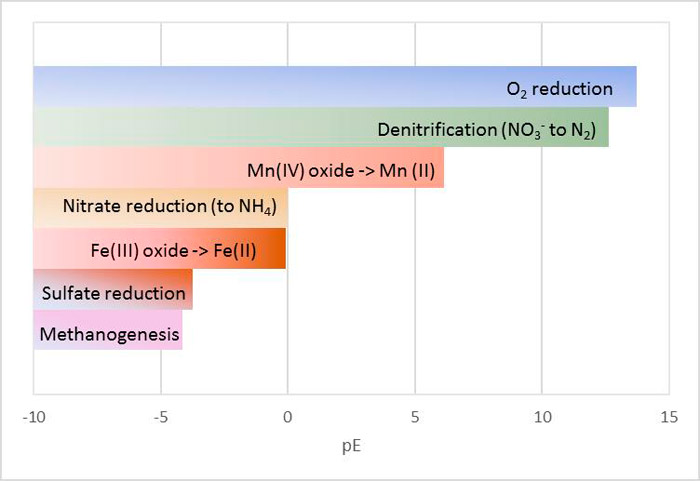
Figure NSZD-2. Electron acceptor ladder.
The sequence of reactions shown in Figure NSZD-2 is determined by how much energy is derived from each of these processes. To the extent possible, microorganisms will follow oxidation processes in the order of decreasing energy gain. For example, if oxygen is present, it will likely be used first, as it is more energetically favorable. This is known as aerobic biodegradation. However, while oxygen is present in ambient air, it can be scarce in the subsurface, so aerobic biodegradation is often limited to shallow depths or fringe areas of the plume where recharge occurs.
Following the concept of the electron acceptor ladder, as oxygen is depleted, microbes sequentially shift to nitrate, then to manganese and iron oxides, and then sulfate as TEAs (Figure NSZD-2). These TEAs might be initially available in limited amounts in all soils and/or groundwater. The oxidation of petroleum (the reaction coupled to the TEA reduction) produces CO2. As the LNAPL spill weathers and TEAs are consumed, they are depleted at the contaminant source, and these TEA-based processes rely on the influx of additional TEAs. Concentration gradients across these geochemical zones are often observable in the dissolved contaminant plume (groundwater surrounding the source, for example see (Lovley, Chapelle, and Woodward 1994), and vadose zone (e.g., (Sihota et al. 2016)). Zones where different geochemical processes occur sometimes overlap (for example methanogenic and sulfate-reducing conditions might co-exist) [(Bethke et al. 2011); (Irrianni-Renno et al. 2016)]. See Section 2.3.2 for more details on the TEA processes and the associated mass losses of petroleum hydrocarbons.
Methanogenesis lies near the bottom of the electron acceptor ladder, since it generates relatively little energy compared to reactions driven by other TEAs. While the implication is that methanogenesis occurs after other TEAs have been depleted, this does not necessarily mean that the rate of methanogenesis will be slow nor that does it rarely occur. To the contrary, methanogenic zones are common in LNAPL source zones, methanogenesis is increasingly acknowledged as a dominant NSZD process ([popuppress id=”43142″]), and the fate of biogas that it generates can be a significant aspect of NSZD assessment. The biogases that methanogenesis produces include methane and carbon dioxide (CH4 and CO2, respectively). See Section 2.3.3 for more details on methanogenesis and the associated mass losses of petroleum hydrocarbons.
2.2 NSZD Processes Expressed Through Vertical Gas Transport
As generally depicted in Figure NSZD-3, the overall NSZD processes expressed primarily via vertical gas transport involve:
- volatilization of LNAPL (early stage sites where there is petroleum hydrocarbon with high volatility);
- shallow aerobic biodegradation of petroleum hydrocarbons, resulting in the consumption of O2 and production of CO2;
- methanogenesis of petroleum hydrocarbons in the anaerobic portion of the saturated, capillary or vadose zones, resulting in the production and vertical transport of CH4 and, to a lesser extent, CO2;
- aerobic oxidation of CH4 produced from methanogenesis, resulting in the consumption of O2 and production of CO2; and
- transport of gases via diffusion, advection and ebullition from the saturated zone.
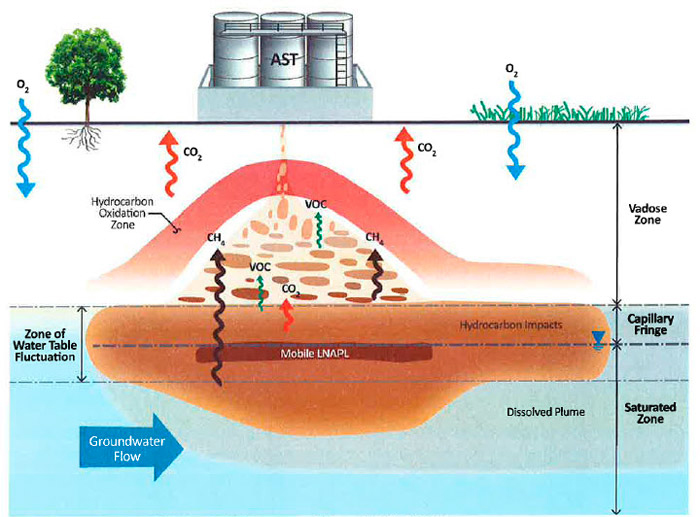
Figure NSZD-3. Vapor transport–related NSZD processes (API 2017).
2.2.1 Volatilization
By-products of NSZD processes are present both in groundwater and the vadose zone. In many cases, it may be appropriate to focus NSZD rate measurements on the vertical, soil gas flux processes because of their dominance of the total NSZD rate. For example, a study at the former Guadalupe oil field in California showed that LNAPL mass loss expressed through changes in aqueous phase geochemistry were two orders of magnitude lower than loss expressed through gas flux (Johnson, Lundegard, and Liu 2006).
LNAPL source mass within the vadose zone is subject to redistribution as soil gas due to volatilization of hydrocarbon constituents. These constituents will volatilize into soil vapor based on their mole fraction and pure chemical vapor pressure. Volatilization of hydrocarbon constituents is most important for lighter molecular weight releases such as gasoline or lighter crude oil fractions and early time after a release into the environment, and becomes a less significant process as the LNAPL ages and the fraction of the most volatile components in the LNAPL becomes smaller.
2.2.2 Gas Transport Processes
With diffusion, volatile constituents or gaseous biodegradation byproducts move from areas of higher concentration to areas of lower concentration. Oxygen utilized in aerobic biodegradation moves from the atmosphere at ground surface to the depth of biodegradation. In contrast, LNAPL constituent vapors or soil gases preferentially migrate from subsurface contaminant source areas towards the ground surface and atmosphere. Migration of these gases via diffusion is driven by concentration gradients. Diffusion is a function of a constituent’s air diffusion coefficient and the air-filled porosity of the soil, and it is faster in soils with more air-filled effective porosity, such as sand with low moisture content. The rate of aerobic biodegradation (e.g., methane oxidation) is predominantly a function of diffusive O2 flux through the soil.
Advection is the movement of bulk soil gas from areas of higher pressure to areas of lower pressure due to the presence of a pressure gradient. For NSZD, advection may become important when the rate of gas generation from methanogenic biodegradation (CH4 and CO2) is high. Research is ongoing on the relative contribution of advection, however results to date suggest most systems to be diffusion dominated. Studies at the National Crude Oil Spill Fate and Natural Attenuation Research Site near Bemidji, Minnesota, show that for a crude oil release exhibiting an NSZD rate of approximately 1,500 gallons per acre-year (Sihota and Mayer 2011), advection was responsible for approximately 15 percent of the net flux of methane (Molins et al. 2010). All other factors being equal, higher NSZD rates (and higher rates of biogenic gas production) would result in a greater advective contribution to biogenic gas flux. Advection of biogenic gasses in the vadose zone can be assessed by measuring nitrogen, argon and/or pressure differentials in soil gas (Amos et al. 2005).
If methanogenesis occurs in the capillary fringe, then advective transport conditions could develop at the base of the vadose zone. Additionally, if methanogenesis is occurring in the saturated zone then, after the groundwater becomes super-saturated with gas, bubble formation will occur that could lead to gas transport to the vadose zone (Amos et al. 2005). Bubble formation is termed degassing. Bubble transport of gas from groundwater to the vadose zone is termed ebullition and occurs episodically (Sihota et al. 2013) along fractures in the soil. Relatively thin soil layers with different soil properties (e.g., a layer of silty soil in medium-grained sand) can have a significant effect on the transport of vapors through unsaturated soils.
Simultaneously to this biogas transport process, oxygen diffuses downward from the atmosphere, and meets the upward migration of methane and petroleum hydrocarbon vapors (if present), creating a hydrocarbon oxidation zone (also termed a methanotrophic zone for the scenario of methane oxidation or the aerobic/anaerobic interface) that produces CO2 and heat [(Sweeney and Ririe 2014); (Warren and Bekins 2015)] according to the overall reaction shown in Equation NSZD-2-1.
CH4 + 2O2 → CO2 (g) + 2H2O (ΔHrxn = 43.9 kJ/g-HC) [Eq. NSZD-2-1]
The location of the oxidation zone is controlled by the ingress of O2 through the ground surface and soil and the gas transport of upward-diffusing VOCs and/or methane (from the methanogenic zone).
2.3 NSZD Processes Expressed Through Lateral Groundwater Transport
Source zone mass is lost as the dissolved-phase constituents and biodegradation by-products leave the source zone via groundwater transport. Figure NSZD-4 depicts the basic elements of NSZD in the saturated source zone including dissolution and biodegradation mass depletion processes that result in changes in groundwater concentrations. Although biodegradation processes in the saturated zone also result in gaseous by-products they are not shown here for simplicity.
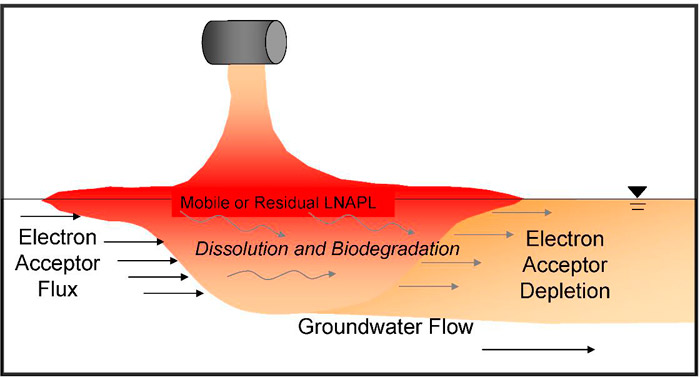
Figure NSZD-4. Groundwater transport–related NSZD processes.
Overall, NSZD processes expressed via lateral groundwater transport involve:
- Dissolution of petroleum constituents in the saturated zone. (Dissolution in this discussion is conceptualized as a saturated zone process, however, it is noted that dissolution can also occur in pore water within the unsaturated zone.)
- Biodegradation via dissolved electron acceptors, resulting in the depletion of oxygen (O2), nitrate (NO3), manganese (Mn4+), ferric iron (Fe3+), and sulfate (SO42-). These reactions result in the production of carbon dioxide (CO2), as well as the reduced forms of these electron acceptors.
- Biodegradation generally proceeds down the electron acceptor ladder (see Figure NSZD-2) to methanogenesis, resulting in the production of CH4 and, to a lesser extent, CO2.
- Significantly smaller mass loss is expressed through changes in groundwater geochemistry and lateral transport than expressed through vapor-phase changes and vertical gas transport.
2.3.1 Dissolution
Portions of source zones that are submerged or in contact with pore water in general are subject to dissolution of LNAPL constituents into groundwater according to the constituents’ aqueous solubility. “Effective solubility” represents the maximum equilibrium concentration of a constituent from a multicomponent NAPL mixture in groundwater at a specific temperature and pressure (EPA 1995). Effective solubility (Sei) of an individual NAPL constituent is a product of its mole fraction in the NAPL (Xi) and solubility of the constituents in its pure phase (Si):
 [Eq. NSZD-2-2]
(Zemo et al. 2013) reported average theoretical effective solubilities of gasoline and diesel, as well as averages from several studies by other authors. Other studies reporting effective solubility estimates for gasoline include, (EPA 1996) and (Falta, Ahsanuzzaman, and Wilson 2012). In some cases, it may be appropriate to determine a site-specific effective solubility value of actual on-site LNAPL using standard test methods (e.g., ASTM Standard E1148) and Equation NSZD-2-2.
While dissolution facilitates NSZD, it not an absolute prerequisite to biotic LNAPL mass depletion processes (see Section 2.4).
2.3.2 Biodegradation: Dissolved Electron Acceptors in the Saturated Zone
As groundwater flows through the submerged source zone, petroleum hydrocarbon constituents dissolve into the groundwater, where they are available for biodegradation. Biodegradation of dissolved petroleum hydrocarbon plumes in groundwater by naturally-occurring microbial populations has been well documented. This biodegradation in the saturated zone is reflected in spatial changes in concentrations of dissolved electron acceptors and dissolved biodegradation by-products. The magnitude of mass loss from these various biodegradation reactions can be determined through monitoring of corresponding changes in groundwater chemistry. Procedures for estimating mass loss expressed through changes in groundwater chemistry are specified in existing guidance documents [(ITRC 2009b) and (NRC 2000)].
Regarding Figure NSZD-4, it is important to acknowledge that not all reaction by-products will remain soluble and leave the source zone. Some reduced by-products will react with soil minerals and create solids. For example, (Ng et al. 2015) found that 91% of iron reduction may not be detected in dissolved phase; the dissolved ferrous iron by-product from biodegradation reacted with naturally occurring sulfur to create iron sulfide solids. Therefore, the estimates of the portion of NSZD as manifested as changes in the aqueous phase using results of groundwater sampling and analysis may underestimate the mass losses.
2.3.3 Biodegradation: Methanogenesis
At sites under anaerobic conditions, methanogenic microorganisms facilitate the degradation of hydrocarbons (e.g., octane C8H18) to create CO2 and CH4, as seen in Equation NSZD-2-3 below.
C8H18 + 3.5 H2O → 1.75 CO2 (g) + 6.25 CH4 (g) [Eq. NSZD-2-3]
The soluble portions of the biodegradation byproducts migrate away from the source with groundwater flow, while the remainder of the CO2 and CH4 partition and transport into the unsaturated phase (vadose zone). Methanogenesis is not limited by external electron acceptors, unlike other anaerobic biodegradation reactions, but may be limited by hydrogen, acetate buildup, availability of nutrients, or temperature [(Wilson, Hers, and Jourabchi 2016) and (Zeman et al. 2014)]. Based on studies of the Bemidji and Guadalupe oil field sites, methanogenesis was demonstrated to be an important NSZD process.
2.4 Direct Biodegradation of LNAPL
Biodegradation of LNAPL source zones via microbial activity in the aqueous phase and vapor phase has been thoroughly described and documented in the technical literature. Although it is commonly assumed that biodegradation or mineralization of source zone constituent mass is limited by the rate of partitioning from the LNAPL to aqueous phase, direct biodegradation of the nonaqueous phase in the subsurface is becoming increasingly recognized as an important NSZD process.
A carefully constructed mass balance on the crude oil released at the National Crude Oil Spill Fate and Natural Attenuation Research Site near Bemidji, Minnesota, by (Ng et al. 2014) pointed to an important gap in the CH4 and CO2 mass balance at the site. The conventional conceptual model, where hydrocarbon constituents must be dissolved in groundwater before they can biodegrade, was unable to explain the magnitude of the measured carbon surface efflux from the LNAPL in the source zone. A new component of the conceptual model was proposed, “Direct outgassing of CH4 and CO2 produced from oil constituents that degrade within the pore space adjacent to the entrapped oil (outgassing mechanism).”
The direct outgassing process involved low solubility compounds (e.g., alkanes) that biodegraded within the LNAPL body “without an intermediate aqueous phase.” Numerical reactive transport modelling of the LNAPL body at Bemidji, (Ng et al. 2014
) showed direct outgassing was a critical part of the site model, with about 70% of carbon loss from the oil attributed to direct outgassing. In a follow-up paper, (Ng et al. 2015) concluded that: “These mass balance results suggest a conceptual framework in which some patches of the oil body are relatively isolated from the flow system, thereby allowing oil-contact biodegradation of low solubility degradable oil constituents, with most biodegradation products (CH4) directly outgassing without first entering aqueous solution.”
Other researchers have investigated the mechanisms for non-aqueous phase biodegradation processes and its application to NSZD. (Ng et al. 2014) cited work by (Meckenstock et al. 2014) who observed high rates of biodegradation in a bulk oil body that contained minuscule water droplets only 1 to 3 uL in size. (Hua and Wang 2014) described very low solubility NAPL phase hydrocarbons that were pseudosolubilized by biosurfactants, and microorganisms that grow in fatty acids and therefore are not in the water phase. The direct outgassing concept is now emerging in the NSZD community; ([popuppress id=”43142″]) described how biodegradation of oil constituents could occur without solubilization into bulk groundwater in a 2017 review paper of NSZD processes and controls.
3.0 Incorporating NSZD into the LNAPL Site Management Process
This section provides an overview of how NSZD concepts fit within the overall evaluation and management of LNAPL sites. NSZD assessments can be conducted at differing levels of complexity and accuracy, and on a range of time scales, based on the stage of the project and the nature of the LCSM.
3.1 NSZD and the LNAPL Conceptual Site Model
As site stakeholders develop an LNAPL Conceptual Site Model (LCSM) in accordance with the guidance in Section 4 of the parent document, the LCSM will typically progress through a series of stages and likely revisions. The initial LCSM will characterize LNAPL concerns and identify drivers for further action, if any. This initial LCSM will evolve into a Remedy Selection LCSM that, based on those drivers, informs selection of a remedial technology (or technologies). Next, a Design and Performance LCSM will guide remedy implementation and performance monitoring until overall remedial objectives have been reached.
NSZD assessment informs the LCSM, but also depends on the overall LCSM for accuracy and representativeness. For example, accurate interpretations of the extent of the overall LNAPL body (including residual LNAPL), the extent and aerobic/anaerobic nature of the vadose zone, and the magnitude of seasonal groundwater fluctuation can be helpful in interpreting the representativeness of individual NSZD measurements relative to a site-wide, annualized degradation rate. Other LCSM components and considerations pertinent to NSZD processes and measurements are covered elsewhere (API 2017).
NSZD assessments can involve varying degrees of complexity, and a range of data quality objectives, in a manner parallel with the evolution and maturation of the LCSM—as illustrated in Figure NSZD-5. Early in the LCSM development and site management process, a screening-level NSZD assessment can confirm that NSZD is active and provide evidence supporting overall stability of the LNAPL body. LNAPL mass loss via NSZD can act to offset/balance the spreading effects caused by localized accumulations of LNAPL/elevated LNAPL saturation and pressure heads. Even though high LNAPL saturations in the release area may cause LNAPL migration laterally toward the periphery of the LNAPL zone, depletion processes concurrently act to reduce LNAPL mass and diminish saturations, thereby balancing the movement (Mahler, Sale, and Lyverse 2012). A qualitative, screening-level NSZD assessment may be all that is needed over the course of the LCSM development (e.g., when NSZD supports continue mass depletion in a risk-based program).
View Figure NSZD-5 in Adobe PDF format.
Figure NSZD-5. NSZD-LCSM relationship.
In the later stages of LCSM development, more quantitative or spatial- and time-integrated NSZD assessments may be used to evaluate the relative benefit of remedial options, to track performance of NSZD relative to other components of a remedial strategy, and to confirm that NSZD continues to contribute to plume stability or contraction. This range of objectives is discussed in the following section.
3.2 Data Quality Objectives for NSZD Assessment
As described in Section 3.1, the role of NSZD assessment in the overall LCSM may vary significantly over the course of a project. Correspondingly, NSZD assessments may target a range of data quality objectives, depending on the anticipated role of the results in the refinement of the LCSM and selection or implementation of remedies.
As depicted on Figure NSZD-6, at the initial stage of a project, NSZD assessment may simply seek to verify that NSZD processes are active and are a potentially viable component of a future site strategy. Data regarding geochemistry, vadose zone characteristics, or hydrogeology may support an understanding of NSZD as well as other aspects of the LCSM. In this case, the objectives of data collection would be focused on verifying that NSZD is contributing to site remediation progress, rather than quantifying that contribution. As an example, an initial assessment may include:
- field-screening of soil gas composition from existing monitoring wells screened across the water table to identify areas of elevated methane or carbon dioxide and depleted oxygen [(Sweeney and Ririe 2017) and (Jewell and Wilson 2011)];
- groundwater sampling to identify areas of increased dissolved-phase hydrocarbons, dissolved iron, manganese, methane, and carbon dioxide, and decreased dissolved oxygen, sulfate, and/or nitrate;
- one-time or “snapshot” measurements of carbon dioxide soil gas flux to identify elevated flux within LNAPL-impacted areas; or
- one-time or “snapshot” vertical profiles of temperatures in existing monitoring wells (spanning both the vadose and saturated zones) to identify biogenic heat contributions within LNAPL-impacted areas.
At sites with extensive investigation and monitoring histories, substantial data for some of these assessment methods may already be available, or additional data could possibly be collected relatively quickly using existing monitoring wells. When a quantitative, time- and/or spatial-integrated NSZD estimate is desired—for example, when evaluating seasonal variability of NSZD rates or comparing NSZD contributions to active recovery measures—data quality objectives may dictate different investigation methods or different temporal applications of measurement methods.
Following completion of the remedy selection and implementation, and transition to a performance LCSM, a different approach to NSZD monitoring could be appropriate. This could include periodic monitoring of CO2 flux, temperature, soil gas composition, or other indicators of NSZD on an annual, biannual, or similar basis, at a small number of representative locations to confirm that NSZD processes remain active and consistent with previous measurements.
Overall, whether the project and LCSM are in an initial stage, a data-intensive remedy selection and implementation stage, or a later performance monitoring stage, the selection of assessment methods should be guided by the LCSM. In many cases, not all methods might be viable- for example, sites covered by concrete might not follow a simple, vertical gas and heat transport model assumed by most of the NSZD quantitation methods. The data quality objectives for each stage of the assessment should be identified before field work is planned, and appropriate to answer the key questions (e.g., verifying NSZD activity, accurately measuring rates, or confirming long-term sustainability of NSZD processes) that are relevant to the project at the time of assessment.
Additional information on data quality objectives for NSZD assessments may be found in the recent American Petroleum Institute guidance document (API 2017).
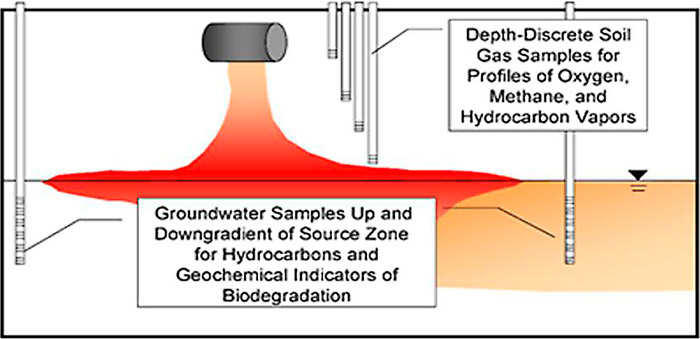
Figure NSZD-6. Data for establishing NSZD occurrence.
3.3 NSZD and LNAPL Compositional Changes
If a remedy contains an LNAPL composition-based remedial objective, then monitoring chemical concentrations within the source zone LNAPL is appropriate. Initial characterization of LNAPL composition should be accomplished as early as possible to establish baseline concentrations. The LNAPL baseline composition can then be used in comparisons with subsequent measurements to evaluate the magnitude and type of changes to the source zone that may have occurred.
Petroleum-based LNAPLs comprise complex mixtures of many chemical constituents (e.g., (ITRC 2018) ; (TPHCWG 1998)). While it is important to characterize the source zone with as much detail as possible, routine NSZD monitoring may be based on fewer reference constituents. The analysis of magnitudes and trends of just a few appropriately selected constituents (e.g., the chemicals driving risk at the site) can provide a robust, long-term NSZD evaluation with minimal laboratory analytical demands.
For example, if the performance metrics are aqueous in nature, then monitoring the TPH fractions (or the contaminant of groundwater concern) in the LNAPL with high aqueous solubility would be important. Since such constituents possess a greater propensity to dissolve in groundwater, they are likely to be a reasonably representative indicator of LNAPL constituent mass transfer. Likewise, monitoring of TPH fractions in the LNAPL with greatest volatility (e.g., vapor pressure) may be used an indicator of remedial effectiveness at sites with concerns involving volatilization to soil gas. Similarly, LNAPL fractions with high toxicities may be used as reference constituents when evaluating potential health risks associated with progress of an NSZD project. (TPHCWG 1997) provides additional discussion selection criteria for TPH reference constituents. Additionally, an Alaskan guidance document contains a useful summary of representative properties of various hydrocarbon fractions (ASCWG 2006).
Over time, as certain TPH fractions are preferentially depleted from the source zone based on their physical and/or chemical properties, the remaining LNAPL composition will change as the remaining constituents become relatively enriched compared to the depleted ones. Such changes in composition are persuasive evidence for the activity of NSZD processes and should be considered in long-term NSZD demonstrations.
3.4 Quantifying NSZD Rates
3.4.1 Methods
NSZD processes expressed through either vertical gas flux or lateral groundwater flow are quantified using a mass balance approach on a control volume. Such control volume includes the zones of the subsurface where the processes analyzed occur (i.e., NSZD reactions). The control volume is defined by a surrounding perimeter known as the control surface. The flow across such control surface of either reactants or reaction by-products is quantified as a mass flux having the units of mass (of the chemical species of interest) per unit control surface area per unit time. Such fluxes provide a way of quantifying what enters and/or leaves the control volume, and thus constitute the metrics by which a reaction rate inside the control volume is derived. Figure NSZD-7 below includes a schematic diagram of such fluxes for both groundwater and gas-transport related processes. All NSZD rate measurement methods rely on derivation of the reaction rate based on a constituent flux.
Procedures for estimating mass loss expressed through lateral changes in groundwater geochemistry are specified in existing guidance documents [(ITRC 2009b); (NRC 2000)].
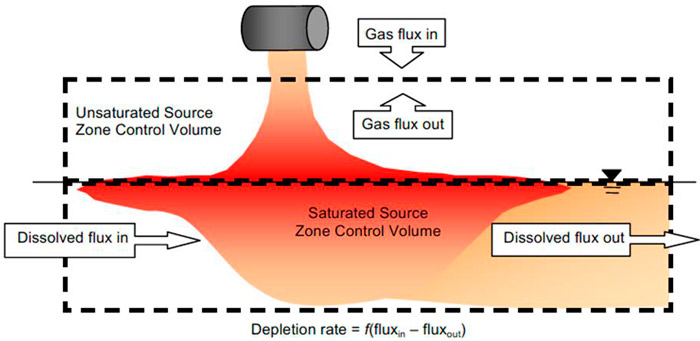
Figure NSZD-7. Example control volume “box” for quantitative assessment of NSZD.
As discussed previously, the component of NSZD expressed in the vertical transport of soil gas typically dominates the total NSZD rate; therefore, the principal methods currently used to quantify the NSZD rate focus on vertical gas flux and are briefly described below. A more detailed discussion of each of these methods is presented in Section 4.
- The gradient method involves the assessment of changes in the vertical distribution of soil gas constituents (principally oxygen and CO2) over the LNAPL source zone footprint, combined with estimates or measurements of the effective diffusion coefficient for the soil gas. The gas flux is calculated using Fick’s first law of diffusion, which can then be stoichiometrically converted to equivalent LNAPL mass loss rates.
- The dynamic closed chamber (DCC) method uses field instrumentation to measure the real-time, short-term (typically a few minutes) direct measurement of soil gas efflux of CO2.
- The passive CO2 flux trap method uses a chemical “trap” that captures CO2 emanating from the soil. This method is designed to be deployed over multiple days, thus avoiding short term efflux variations.
- Biogenic heat methods are based on the principle that hydrocarbon biodegradation is an exothermic process that produces energy. By quantifying the heat signal in the subsurface and assessing the temperature data in an energy balance that accounts for heat transport and microbial heat production (or enthalpy), temperature data can be converted into biodegradation rates.
These methods, all based on the vertical flux of biogenic gases, are compared and contrasted in Table NSZD-1.
Table NSZD-1. Method comparison table
View Table NSZD-1 in Adobe PDF format.
In various ways, each of the methods described above relies on the assumption that methane is oxidized. Depending on site conditions which are generally atypical, the rate of methane generation can sometimes exceed the site’s methane oxidation capacity. In this case, the above methods will result in under-estimation of the NSZD rate if methane efflux from the subsurface is incorrectly assumed to be zero.
3.4.2 General NSZD Rate Measurement Considerations
Temporal Variability and Frequency of Measurements ▼Read more
Spatial Variability and Number of Measurements ▼Read more
Background Considerations ▼Read more
Stoichiometry and Units of Measurement ▼Read more
4.0 Methods of NSZD Rate Quantification
The following sections summarize the methods to measure NSZD rates as expressed through vertical gas flux. It presents details of the gradient, passive flux trap, DCC, and biogenic heat methods. It should be noted that the API document titled Quantification of Vapor Phase-Related Natural Source Zone Depletion Processes is a comprehensive assessment of the current state of NSZD measurement methodologies and presents the best practices regarding implementation of the gradient and CO2 efflux methods (API 2017).
4.1 Gradient Method
4.1.1 Method Description
Petroleum hydrocarbon mass loss by volatilization and biodegradation can be evaluated by assessing changes in the vertical distribution of soil gas constituents (O2, CO2, methane, and vapor phase petroleum hydrocarbons) in the soil gas above the LNAPL-impacted soil. Changes in the vertical profile of soil gas composition are combined with measurements of the effective soil vapor diffusion coefficient in order to estimate the downward flux of oxygen, or the upward flux of CO2 (and methane and hydrocarbons, if present). As discussed in Section 2.2, these fluxes may be equated stoichiometrically to equivalent LNAPL mass loss rates (Johnson, Lundegard, and Liu 2006).
This approach relies on a one-dimensional application of Fick’s first law as shown in Equation NSZD-4-1 and is generally referred to as the gradient method.
 [Eq. NSZD-4-1]
It typically uses depth-discrete soil gas sampling results to estimate concentration gradients (dC/dz), and field testing data to estimate the vapor-phase diffusion coefficient ( ). The resulting flux (J) is then used to stoichiometrically estimate a rate of hydrocarbon mass loss. The approach relies on several simplifying assumptions:
- Diffusion is the only significant transport mechanism (e.g., advection of soil gas is insignificant and the species of interest is not reactive within the monitoring points used for the measurement—while oxygen flux is typically dominated by diffusion, advective transport of biogenic gasses may be important at depth due to methanogenesis (e.g., Molins et al. 2010),
- Migration processes are predominantly vertical and in a quasi-steady-state (i.e., temporal variations are insignificant), and
- Biodegradation of hydrocarbons (including CH4) is the dominant sink for oxygen, and the dominant source of carbon dioxide and methane (i.e., background soil respiration is negligible or can be accounted for separately).
4.1.2 Measurement Methodology
The effective vapor phase diffusion coefficient may be measured in the field (Johnson et al. 1998) or estimated from soil moisture and total porosity (Millington and Quirk 1961). Soil gas concentration profiles can also be measured in the field using multi-depth soil gas probes. Further information on selection of horizontal and vertical locations of soil gas probes is described in the API NSZD guidance document (API 2017).
4.1.3 Method Limitations and Interferences
The gradient method is based on an assumption of diffusive gas transport (with the corollary that advection is negligible). It is currently believed that diffusion is dominant at many sites, with advection theoretically contributing more to biogenic gas transport at sites with higher NSZD rates. Additional information on diffusion versus advection is presented in Section 2.3.
A critical parameter in analysis of the soil gas data is the vapor phase diffusion coefficient. At heterogeneous sites, the value of this coefficient can vary by several orders of magnitude, making this a difficult parameter to estimate for quantitative calculation of NSZD rates ([popuppress id=”43142″]). The coefficient varies not only spatially, but also temporally along with changes in soil moisture content. Spatial variability can occur both laterally and vertically; establishment of a representative coefficient for layered soil is particularly challenging. Use of an assumed value, or extrapolation of a field testing-derived value to other locations or points in time, introduces a degree of inaccuracy into the derived loss rates. Location-specific measurement of the soil gas diffusivity concurrent to the time that gas samples are collected is recommended.
Conceptually, the simplifying assumptions involved in this method’s application of Fick’s law (Section 4.1.1) are not valid at all subsurface locations, but might be validated if applied to a linear section of the gradient that experiences minimal changes in time (at steady state). Judicious positioning of a gradient “control plane” can enhance the validity of these assumptions and reduce the potential for error. The reactant flux (hydrocarbon mass loss) can be quantified by locating a horizontal reference plane above the source zone at a height (z) (Figure NSZD-8). The ideal location (z) for this reference plane is below the root zone (where natural soil respiration is most significant), and above the zone of methane oxidation. This depth typically corresponds to the aerobic/anaerobic interface (Sweeney and Ririe 2014). Oxygen tends to be near zero below this interface, and methane tends to be near zero above this interface.
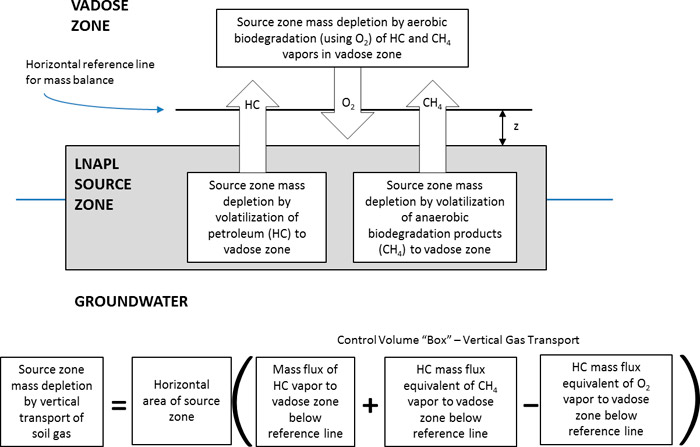
Figure NSZD-8. Reference diagram for NSZD mass depletion processes.
4.1.4 Gradient Method Nomograms
Gradient method nomograms, described below, are useful tools for designing an NSZD assessment program, predicting a range of potential results, and assessing and communicating results. The nomograms are for screening-level purposes only. The nomogram method is not recommended to serve as a substitute for site-specific NSZD field assessments.
Where natural soil respiration is negligible, the calculation of oxygen flux is often driven by two points: the concentration of oxygen at the soil surface, and the depth where the oxygen concentration diminishes to (near) zero. A simplified NSZD assessment may be conducted using a nomogram that assumes that depth and oxygen diffusion coefficient are the dominant inputs for NSZD. Nomograms are drawn using established theoretical analytical equations and a set of known existing or assumed parameters. Because some site-specific parameters may not yet have been measured, they are typically run using a range of values that could be representative of field conditions. Nomograms are also typically graphical in nature, have one axis that is the desired value (i.e., the NSZD rate), and the other axis uses a parameter that is readily available. Inherent to theoretical analysis, they make many simplifying assumptions and as a result, their data quality is considered screening-level.
Figure NSZD-9 represents an example NSZD rate estimate nomogram based on application of Fick’s first law (Equation NSZD-4-1). The nomogram plots estimated hydrocarbon degradation rates for generic soil types with effective O2 diffusion coefficients derived from the Millington-Quirk equation with porosity and moisture contents summarized in Table NSZD-2. These plots assume:
- a single homogeneous and isotropic clean soil exists above the LNAPL smear zone;
- no soil O2 consumption occurs due to natural soil respiration;
- the horizontal reference plane exists where O2 is zero and oxidation of CH4 is complete; and
- the O2 gradient is linear and estimated from atmosphere to the depth of the horizontal reference plane.
The user selects a horizontal reference plane above the LNAPL smear zone using available site knowledge, such as depth to LNAPL affected soils identified in boring logs, zero O2 concentrations identified in soil gas profiles or monitoring well screening samples (Section 3.2), or a historic high LNAPL-water interface elevation. Figure NSZD-9 indicates that for a site with clean sand above the LNAPL smear zone with an average depth to the LNAPL-water interface of 6 meters below ground, a hydrocarbon biodegradation rate of 2.6 g/m2/day may be expected.
The diffusion coefficient (as estimated using the (Millington and Quirk 1961) relation) can vary an order of magnitude based on porosity and moisture content, as evidenced in the two clay examples shown below, with 40 and 60 percent water saturation. Site-specific nomograms may be developed to narrow the range of estimated NSZD rates. Nomograms can be developed for more complex soil distributions by developing an overall diffusion coefficient for the soil column using summation methods described in (Johnson et al. 1998).
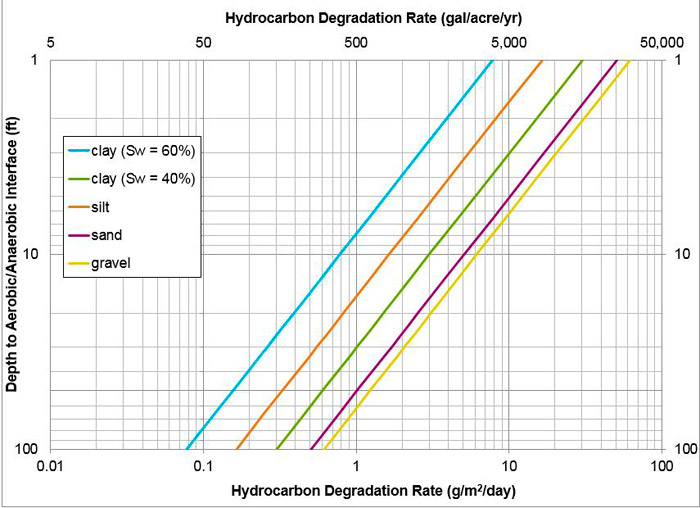
Figure NSZD-9. Example of nomogram to estimate NSZD rates. Note that typical aerobic/anaerobic interface depths and hydrocarbon degradation rates would fall toward the center of the plot area shown.
Table NSZD-2. Porosity and water content inputs and Millington-Quirk diffusion coefficient estimates for Figure NSZD-9 Example Nomogram
| Soil type | Porosity | Soil moisture content (percent) | Effective O2 diffusion coefficient (cm2/sec) |
|---|---|---|---|
| Clay | 0.5 | 60 | 0.003 |
| Clay | 0.5 | 40 | 0.013 |
| Silt | 0.5 | 50 | 0.007 |
| Sand | 0.36 | 20 | 0.021 |
| Gravel | 0.31 | 10 | 0.026 |
4.2 Passive CO2 Flux Trap Method
4.2.1 Method Description
The passive CO2 flux trap method was developed specifically to monitor NSZD using a stoichiometric conversion of the rate of CO2 efflux from LNAPL degradation (McCoy et al. 2014), according to Equation NSZD-4-2 for a representative petroleum hydrocarbon (the equation may be modified to suit site-specific hydrocarbon composition):
2 C8H18 + 25 O2 → 16 CO2 + 18 H2O [Eq. NSZD-4-2]
This method was co-developed and patented by Colorado State University and Chevron U.S.A. (U.S. Patent No. 8,714,034). This technology is licensed and commercialized by E-Flux, LLC (Fort Collins, CO, USA).
The passive CO2 flux trap captures the CO2 emanating from the soil surface over a multi-day duration of time. After field deployment, the traps are collected, capped, and then shipped back to the vendor for laboratory analysis. Knowing the cross-sectional capture area and the deployment time, the cumulative CO2 mass released by the soil (and captured by the trap) is then used to calculate the flux. The standard practice for passive flux traps is to analyze both total carbon and 14C (radiocarbon dating by atomic mass spectroscopy) to differentiate the contributions to the sample from modern CO2 (background generated from natural organic matter in the soil) and fossil fuel CO2 (generated from biodegradation of LNAPL contaminants).
4.2.2 Measurement Methodology
As shown on Figure NSZD-10, the passive CO2 trap setup consists of a cartridge with CO2 sorbent (a strong base) that is coupled to a receiver (pipe) preinstalled into the soil. The receiver is a short section of pipe that is driven into the ground, to a depth of a couple inches, just enough to make a seal with the soil. During receiver installation, care is taken to minimize soil disturbance by recompacting soil within and around the receiver back to its original level. A rain cover is attached to the cartridge to protect the sorbent material from unexpected rain during deployment. The traps are deployed for multiple days, typically 2 weeks, to capture the CO2 emanating from the soil. The deployment time is limited to avoid saturation of the sorbent (in the order of 30% content in weight, as mass CO2/mass of sorbent).
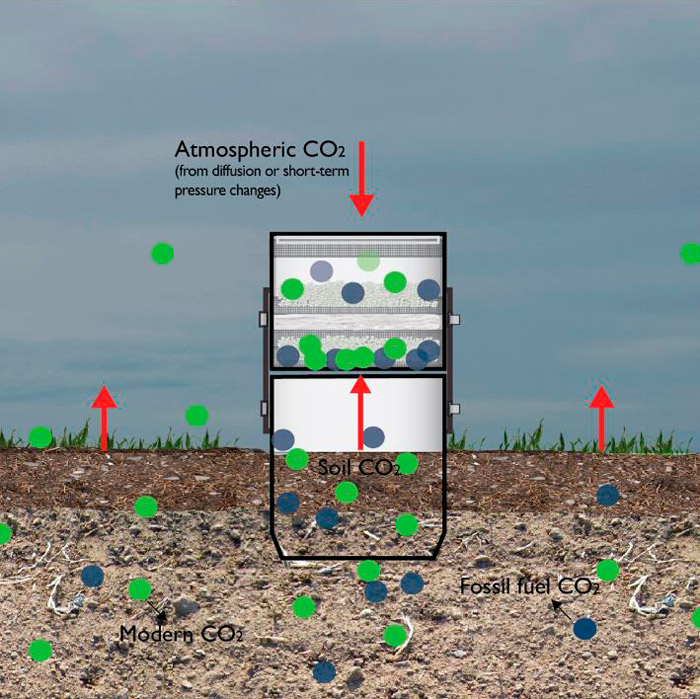
Figure NSZD-10. Schematic of the passive CO2 trap, and the separate capture of CO2 leaving the soil (associated with the soil gas efflux) and the ambient CO2 interference (Figure provided by vendor E-Flux, used with permission).
The traps have a two-layered design, to differentiate soil gas effluxes (i.e., CO2 leaving the soil into the atmosphere) from that atmospheric CO2 that either diffuses into the cartridge or flows downward (i.e., due to atmospheric pressure changes driving ambient gas into the soil). Short-term fluctuations in total soil gas flux, including flow reversals are known to occur (Ma et al. 2013), either due to barometric pumping (changes in ambient pressure), ambient temperature changes, and/or the CO2 production rates associated with shallow soil production processes. Such processes are diurnal and climatological in nature, and the total soil gas flux (inclusive of natural organic matter respiration) often follows a diurnal pattern.
As the reaction between CO2 and the sorbent is fast and no breakthrough occurs (i.e., deployment duration does not allow for sorbent saturation), the two trap elements permit capture of the mass of CO2 associated with the average soil gas efflux while preventing the influx of atmospheric CO2 into the sample during the period of deployment. The CO2 mass associated with the soil gas efflux is reported by the vendor as the basis to estimate NSZD rates.
Additional features of the passive CO2 traps are:
- The sorbent is porous, so it allows for free gas exchange between soil and atmosphere through the trap, avoiding pressure buildup within the device.
- The traps have no moving parts and require no power, so can be deployed in remote areas.
- The capture area corresponds to either a 4” diameter receiver pipe (standard) or 8” diameter (for added sensitivity).
- The analysis of the trap is performed in the lab, after traps are returned to the vendor. This includes total CO2 analysis (to calculate the total CO2 efflux), as well as radiocarbon isotopic analysis (14C) as described below.
- Results are travel blank corrected, using an extra cartridge that is not deployed (a travel blank). This is necessary to account for the initial measurable low amount of CO2 (and its 14C isotopic contribution) inherently contained in the sorbent from the manufacturer.
- The lab analysis typically requires four weeks to receive results.
The radiocarbon isotopic background correction relies on measuring 14C concentrations in the CO2 efflux. Ambient air is 14C rich, as this isotope is created by the cosmic rays on the atmosphere. Ambient CO2 is incorporated into the food chain through photosynthesis, preserving the atmospheric 14C ratio. This isotope is not stable, decaying with a half-life of ~5,700 years (Aelion, Kirtland, and Stone 1997). As LNAPL is millions of years old, it is completely depleted of 14C. Based on this, a two-source model is available to allocate contributions from both sources to an environmental sample, assuming that modern carbon has 14C levels near atmospheric, and fossil fuel has no 14C (ASTM 2014b). This technique is often referred to as radiocarbon dating. Applications to NSZD were reported in one of the first case studies of the passive CO2 traps (McCoy et al. 2014), and now are standard for this technique. As this correction is location-specific, it obviates the need for CO2 efflux monitoring from background locations.
4.2.3 Method Limitations and Interferences
As with other methods to measure gaseous efflux at ground surface (e.g., DCC), passive flux trap locations need to be located in soils that can permit gas transport. If they are installed within impervious, compacted, or low permeability zones and penetrate a layer confining to the underlying soil vapor, then a preferential flow path (i.e., a chimney) will be created and results will be non-representative of natural gas efflux. As such, these surface methods should not be installed in concrete or asphalt pavement, or very hard compacted soils.
Installation of passive flux traps in background locations is not necessary, as a 14C correction is used. This isotopic correction is performed on the traps atop the LNAPL footprint and eliminate the need for separate traps in background, unimpacted areas.
The detection limit of the passive flux trap method is based on the detection limits of the analytical method used. For a capture area corresponding to a 4” diameter receiver, a deployment time of 4 days, and a trap with 40 grams of sorbent, the resulting detection limit for total CO2 flux is 0.5 µmol/m2/s. A typical deployment of two weeks results in a total CO2 flux detection limit of approximately 0.1 µmol/m2/s (sufficient to detect most field-observed fluxes). The high sensitivity of the two source model on which ASTM D6686-12 is based can detect even small fossil fuel contributions to the sample (in the order of 1-2%) on the captured CO2. The sensitivities described can be lowered by a factor of 4 by changing to an 8” diameter receiver.
Additional factors to be considered affecting the trap measurements (and some of the other methods as well) include wind and rain:
- Wind has been shown to affect all methods to estimate NSZD based on gas transport, although the particular bias reported in that work were not realistic, as the conditions were not representative of field conditions. Strong wind might bias the DCC results low, whereas for the trap, a high wind has been shown to bias results high. The latest trap design has a reduced top view footprint and height (with respect to the original design), modifications proven to reduce bias. Other things being equal, the bias is proportional to wind velocity. For example, if sustained for the period of measurement, a moderate breeze of 15 miles per hour (mph) (as measured at an elevation of 10 m above ground, a level sufficient to raise dust from the ground and move small branches on trees) was shown to create a high bias on the CO2 traps of +7% and a loss bias of -30% for the DCC (E-Flux 2015). If unusually windy conditions are expected at a field site during CO2 trap use, additional efforts should be made to understand the magnitude of this bias and mitigating measures (E-Flux 2015).
- Heavy or persistent rain might result in either soil saturation during trap deployment or different soil moisture levels between the site and under the trap. If this results in saturated soil conditions, it may shut down gas transport, even if microbial activity at the contamination depth is unaltered, creating a low bias on the results. Small amounts of moisture that do not saturate the soil might result in preferential flow towards the trap, resulting in a potential high bias. The magnitude of such high bias has not been determined. If possible, it is best to avoid significant rain events during trap deployment, even if this result in needing an 8” trap diameter (see above discussion on detection limits).
4.3 Dynamic Closed Chamber Method
4.3.1 Method Description
The dynamic closed chamber (DCC) method was adapted by researchers at University of British Columbia for estimation of NSZD rates (Sihota and Mayer 2011). The DCC method involves measurement of the CO2 efflux using a shallow-embedded, ground surface-based flux chamber, typically equipped with a circulation pump and real time gas detector (i.e., an infrared gas analyzer). DCC systems use the rate of increase of CO2 concentration in a measurement chamber to estimate the efflux. For such an estimate to be valid and representative, pressure and temperature conditions must be similar inside and outside the chamber. Similarly to the passive CO2 flux trap method, it is assumed that all petroleum hydrocarbon vapors including methane in the unsaturated soil zone are converted to CO2 and that the LNAPL degradation rate can be estimated from stoichiometric considerations for the biodegradation of representative petroleum hydrocarbon compound.
4.3.2 Measurement Methodology
One example of a DCC system is the LI-8100A analyzer, manufactured by LI-COR Biosciences (Lincoln, NE, USA). It is a fully automated system dedicated to making measurements of soil CO2 flux (see Figure NSZD-11). The analyzer control unit powers either a survey or long-term measurement chamber, and houses the system electronics and the infrared gas analyzer (IRGA) used to measure the change in CO2 concentration in the flux chamber (along with other parameters important for accurate CO2 efflux calculations—e.g., water vapor (LI-COR 2014)). The LI-8100A survey chamber allows for rapid measurements to be made at many locations (20 – 50 per day, depending on site size), and the long-term measurement chamber supports automated, sequential measurements at a single location over time (hours to months). Both chambers have engineered pressure vents to prevent pressure gradients and wind incursion from outside the chamber. To date, the survey chamber has been more frequently used in NSZD assessments than the long-term chamber.
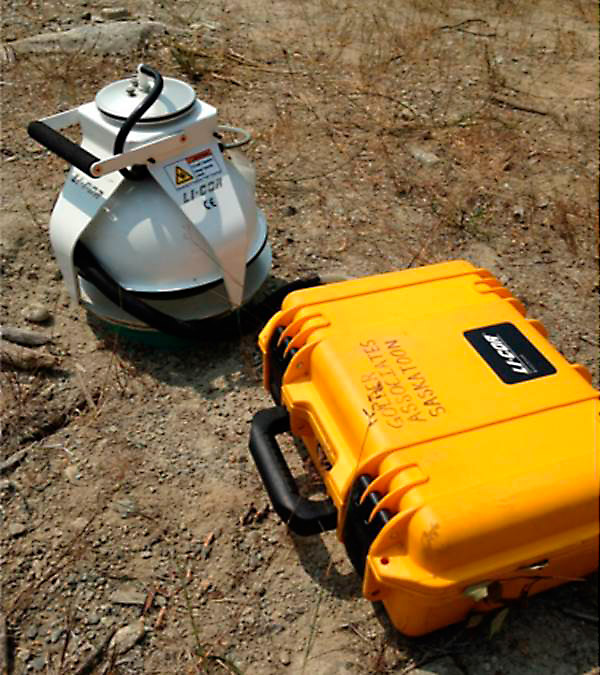
Figure NSZD-11. LI-8100A Automated Soil Gas Flux System with survey chamber (left) and infrared gas analyzer (right).
The LI-8100A survey chamber is placed on a collar that consists of an 8-inch diameter section of plastic pipe, approximately 4 inches long. This collar is similar to the receiver pipe described for the CO2 trap method in Section 4.2. The collar is pushed or driven approximately 2 to 3 inches into the soil, and is typically installed at least 24 hours prior to flux measurement. As with CO2 sorbent traps, the method assumes that upward soil gas flux into the collar is representative of an equivalent area of the subsurface, and that flux into the collar and DCC is not increased by formation of preferential pathways or decreased by permeability reductions from collar installation. Therefore, disturbance of soil within and around the collar should be minimized; however, shallow organic material (e.g., plant litter) to reduce sources of non-petroleum related CO2. Coarse-grained surficial material such as gravel and cobbles should also be removed prior to collar placement to prevent short-circuiting of flow from the atmosphere into the chamber.
The efflux is estimated using a linear or exponential regression of the increase in CO2 concentration within the chamber headspace, typically using software provided by the chamber manufacturer. This makes it possible to estimate the initial rate of CO2 increase that occurred immediately after the chamber closed, and minimize the degree to which elevated concentrations of CO2 in the chamber affect flux. Accordingly, measurement times should typically be limited to about 1½ to 3 minutes in order to keep chamber CO2 concentration changes small.
4.3.3 Method Limitations and Interferences
There are similar limitations with the DCC method as compared to other flux-based soil gas methods. DCC measurements should be conducted in soils that permit gas transport. To address natural soil respiration and the influence from background sources of CO2, DCC measurements in background locations and/or 14C correction should be performed.
Use of 14C isotopic analysis is documented for the DCC method [(Sihota and Mayer 2011) and (Eichert et al. 2017)]. As the flux measurements of the DCC are short term, such application is considered a method in development (API 2017). Additional research on 14C correction for the DCC method is ongoing.
A limitation of the DCC survey-chamber method is that it provides for a snapshot measurement. Because production of CO2 from both NSZD and natural soil respiration varies temporally on varying timescales (diurnally to seasonally) and is influenced by external factors (e.g., soil moisture and temperature), it is important to include these considerations and factors in the LCSM development and advisable to conduct repeat measurements at a subset of locations, which can readily be incorporated in the overall sampling strategy.
Soil moisture can affect soil gas transport, and gas exchange at ground surface and microbial processes and rates are affected by temperature; although, based on cold climate studies, the effect of temperature is typically relatively small (Hers et al. 2014). (Sihota et al. 2016) demonstrates the seasonal variability in DCC measurements of CO2 efflux with peak measurements during late spring and summer at a crude oil spill site (Bemidji, MN). This study also found that frozen soils acted to inhibit gas transport and resulted in decreased CO2 efflux measurements. NSZD rates estimated from DCC CO2 efflux measurements may vary over orders of magnitude depending on site conditions. Variations associated with near-surface soil conditions are not necessarily related to or concurrent with variations in the actual rate of NSZD occurring at greater depth; rather, these variations affect the ability to observe NSZD indicators through soil gas flux. Consequently, CO2 efflux measurements should be avoided during and shortly after rainfall events. Soil physical properties including water retention may be used to assess the effect of rainfall events and infiltration on soil moisture.
4.4 Biogenic Heat Methods
4.4.1 Method Description
NSZD thermal signatures are closely related to the NSZD processes expressed through vertical gas transport (Section 2.2), described as part of the oxidation of methane and petroleum hydrocarbons in the vadose zone. The concept of biogenic heat from NSZD processes in the subsurface is analogous to a compost pile which generates heat, with heat being transferred to its surroundings.
Local soil temperatures at a petroleum release site will be impacted by surrounding ambient temperatures, heat released from biodegradation, and the subsurface heat transfer processes. For instance, (Warren and Bekins 2015) investigated thermal signatures from NSZD at the Bemidji, Minnesota site and found temperatures above the crude oil body in the vadose zone were up to 2.7 ºC higher than temperatures outside the LNAPL footprint. CO2 efflux data acquired from an independent study were found to be comparable to rates estimated from biogenic heat measurements. Additionally, (Sweeney and Ririe 2014) found that the subsurface temperatures in an LNAPL-impacted location were consistently higher than a background area, typically ranging from 2 to 2.5 ºC.
- Microbial degradation is an exothermic process that produces energy. By quantifying the heat signal in the subsurface and assessing the temperature data in an energy balance that accounts for heat transport, a measure of biodegradation rates of petroleum hydrocarbons can be achieved (Warren and Bekins 2015). These microbial reactions can occur in either the unsaturated or saturated zone, and in some cases involve a two-step process such as: 1) methane generation in anaerobic zones above and below the water table, and 2) the methane oxidation in the unsaturated zone by naturally occurring bacteria utilizing oxygen diffusing in from the surface. For the various biodegradation reactions of interest, the heat of reaction (DH), as approximated by the change in enthalpy, is summarized in Table NSZD-3.
Table NSZD-3: Heats of reaction (change in enthalpy) for biodegradation of a model hydrocarbon constituent
| Biodegradation Reaction (Decane as Model Petroleum Hydrocarbon Constituent) | Approximate Change in Enthalpy* | |
|---|---|---|
| kJ/mole | kJ/g | |
| Aerobic Respiration C10H22 + 15.5 O2 → 10 CO2 + 11 H20 |
-6790 | -48 |
| Denitrification C10H22 + 12.4NO3– + 12.4H+ → 10 CO2 + 17 H20 + 12.4 N2 |
-6320 | -44 |
| Manganese Reduction C10H22 + 31 MnO2 + 62 H+ → 10 CO2 + 31 Mn2+ + 42 H20 |
-6560 | -46 |
| Iron Reduction C10H22 + 62 Fe(OH)3 + 124 H+ → 10 CO2 + 62 Fe2+ + 166 H20 |
-5160 | -36 |
| Sulfate Reduction C10H22 + 7.75 SO42- + 15.5 H+ → 10 CO2 + 7.75 H2S + 11 H20 |
-230 | -2 |
| Methanogenesis C10H22 + 4.5 H2O → 2.25 CO2 + 7.75 CH4 |
-25 | -0.2 |
| Methane Oxidation (methane from 1 mole decane) 7.75 CH4 + 15.5 O2 → 7.75 CO2 + 15.5 H20 |
-6770** | -48** |
| Biodegradation reactions based on ([popuppress id=”44402″]).Reactant and product enthalpies (input parameters for calculation change in enthalpy for the complete reaction) from compilation in ([popuppress id=”44412″]). * Negative value signifies release of heat in the reaction. ** Enthalpy denominator is on decane basis. |
||
If pseudo steady-state biomass levels exist in soil, then the rate of heat release will equal the rate of hydrocarbon degradation multiplied by the heat of reaction (DH). Since the heat of reactions for both methane oxidation and aerobic biodegradation are similar, sole use of the methane oxidation heat of reaction may be used to account for the majority of the mass of degradation (assuming that reaction mechanisms based on external electron acceptors are negligible).
Quantification of the NSZD rate from the heat signal of biodegradation involves two key steps: i) evaluation of the heat flux; and ii) conversion to a biodegradation rate using the heat released from the biodegradation reaction.
The evaluation of heat flux is essentially comprised of an energy balance on a control volume and recognition of heat conduction as the mechanism of heat transfer in the subsurface. Figure NSZD-12 illustrates the hydrocarbon oxidation zone (where the majority of biogenic heat his produced) and Figure NSZD-13 illustrates the corresponding depth vs. temperature profile of background-corrected temperatures.
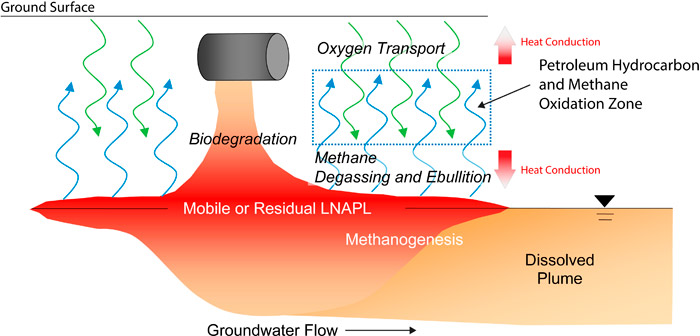
Figure NSZD-12. Petroleum hydrocarbon and methane oxidation zone.
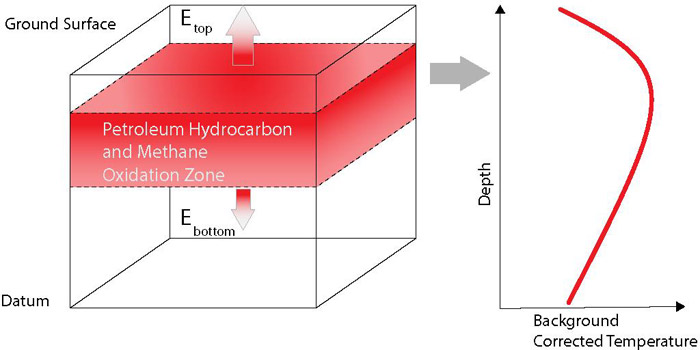
Figure NSZD-13. Vertical profile of background-corrected temperature.
Heat conduction in the subsurface follows Fourier’s Law and can be simplified to a one-dimensional heat flux in the vertical direction as follows:
qh = ‐KT (ΔT/Δz) [Eq. NSZD-4-3]
where qh is the heat flux (J/m2/s), KT is the thermal conductivity of the soil (J/s/m/ºC), ΔT is the change in background-corrected temperature (ºC), and Δz (m) is the depth interval across which heat flux is calculated. The soil thermal conductivity is a volume-weighted average from different lithologies in the vadose zone. Soil thermal conductivity can range from 0.1 J/s/m/ºC (for dry fine-medium textured soil) up to 4 J/s/m/ºC (for water saturated sand) and is dependent on soil moisture content (Sweeney and Ririe 2014).
The total heat flux in the energy balance of the control volume includes the sum of the upward heat flux (to the ground surface), as well as downward heat flux (to the saturated zone).
qT = ‐KT (ΔT/Δz) upward – KT (ΔT/Δz) downward [Eq. NSZD-4-4]
An NSZD rate is then obtained by using the total heat flux as well as the heat released from the biodegradation reaction, as seen in the following expression:
RNSZD = qT/ ΔHrxn [Eq. NSZD-4-5]
where RNSZD is the NSZD rate in units of (g-HC/m2/s), qT is the heat flux (J/m2/s), and ΔHrxn is the heat of reaction of hydrocarbon biodegradation.
4.4.2 Measurement Methodology
The essential component of the thermal approach is a temperature monitoring device such as a thermocouple, thermistor, or Resistance Temperature Detectors (RTDs), with off-the shelf thermocouples being used in most applications to date. However, it should be noted that this is an emerging methodology and, to date, a standard approach has not been developed. Once installed, thermocouples can provide temperature data for an extended period (likely several years at a minimum). These thermocouples can either be manually handled or, analogous to remote acquisition of continuous water elevation data from a transducer, also be easily connected to a data logger and cell phone for remote acquisition of continuous temperature data. Self-contained temperature data loggers can be deployed in existing monitoring wells following a similar principal (Sweeney and Ririe 2014). Once downloaded, the data can be evaluated to isolate the biogenic heat and ultimately converted to cumulative LNAPL loss rates through use of an energy balance. A network of multi-depth temperature sensors (which must be evaluated relative to a representative background temperature profile) can provide for:
- continuous NSZD rate monitoring, thus mitigating concerns with temporal variability and associated uncertainty on the representativeness of other methods relying on a “snapshot” of site conditions; and
- long-term performance monitoring in those situations where NSZD is serving as a long-term remedy and tracking of LNAPL mass depletion over time is appropriate.
Different methods can be used for obtaining subsurface temperature measurements. Temperature gradients have been estimated by using probes or temperature data loggers installed in existing groundwater monitoring wells (Sweeney and Ririe 2014). In a USGS study conducted at the national Crude Oil Spill Fate and Natural Attenuation site in Bemidji, MN, vadose zone temperature measurements were collected with temperature data loggers housed in a water-filled PVC pipe (Warren and Bekins 2015). This installation method achieved the objectives of not having any above-ground equipment and allowing instrumentation retrieval/redeployment; the pipes were filled with water and polyester filling “plugs” to mitigate convection. Measurement of subsurface temperatures can also be achieved by installing thermocouples directly in the ground so that there is direct thermal communication with subsurface media (soil and groundwater). A vertical array of thermocouples can be attached to a PVC rod, and can then be installed using conventional drilling techniques.
A background correction is required in order to account for natural temperature changes in the subsurface. Generally, the background correction is achieved by conducting measurements at a location outside of the LNAPL body with similar geology and surface types. The temperatures at specific depths of the background location are then subtracted from those of the LNAPL-impacted location. The background correction is a sensitive and critical step in the application of the biogenic heat method. When selecting measurement locations, care should also be taken to avoid potential thermal interferences, such as anthropogenic heat sources or sinks and non-representative locations with temperature-altering conditions (utilities, persistent shadows, concentration of runoff/infiltration, foundations). Additional considerations are presented in Section 4.4.3. This is an area where the best practices are still evolving.
Representative background temperature measurements may not be available or reliable at all sites; in these cases, it is possible to estimate background temperature using mathematical models, and compare measured temperatures to the modeled background to evaluate biogenic heat production. One model is described by (Sweeney and Ririe 2014), and uses annual temperature data and soil thermal properties to predict subsurface temperature as a function of depth and time of year. When using this approach, care should be taken to ensure that the site measurements collected are not subject to interferences not reflected in the background model.
4.4.3 Method Limitations and Interferences
Limitations of the biogenic heat method and design considerations include:
- As with the other methods that measure vadose zone gas transport and reaction processes, the biogenic heat method requires background correction. Background locations should be placed in a clean area on-site with similar surface cover, soil stratigraphy, and depth to groundwater as the measurement point within the LNAPL zone. Significant differences in soil type, surface temperatures, and vegetation cover might introduce significant errors through this assumption, sometimes evidenced by higher background temperatures than those at the impacted ones. Additional factors should be considered in selecting a background location for thermal NSZD measurements. Sources of subsurface heat other than hydrocarbon-impacted soil (e.g., active pipelines, high surface water recharge, etc.) can affect interpretation of subsurface temperatures. As such, thermal monitoring locations within both the LNAPL-impacted and background locations should be selected after detailed evaluation of other heat sources.
- Temperatures used for temperature gradient measurements should be located outside of the reactive zone. The depth of the methane oxidation zone (typically the primary source of biogenic heat) can vary and is affected by soil moisture and atmospheric exchange of oxygen. However, proper placement of temperature measurement points along the vertical transect (and equivalent depths in background-correction), allow for identification of the depth of the oxidation zone.
- The reactions occurring within the reactive zone need to be known, in order to calculate the corresponding heat of reaction. When NSZD is dominated by methanogenesis as is often the case, this aspect does not result in significant uncertainty in data interpretation considering the similar heats of reaction for methane oxidation and hydrocarbon oxidation.
5.0 Considerations in Long-term LNAPL site Management
5.1 Evolution of the LNAPL Source Zone
The combination of NSZD in the LNAPL source zone and MNA in the associated aqueous phase plume, with appropriate monitoring to assure attainment of performance objectives, will often constitute the final step in remediation of an LNAPL release site. In some cases, NSZD may be evaluated as the primary remedy at late-stage release site where LNAPL is no longer mobile, the LNAPL mass continues to be depleted, and the aqueous phase plume is in stable-shrinking status. In considering NSZD as a long-term remedy, pertinent issues and questions include the following:
- With the significant rates of LNAPL mass loss that are being measured at many sites (rates as high as thousands of gallons per acre per year), how long will the LNAPL zone persist?
- The NSZD rate measurement methods described herein provide bulk LNAPL loss rates. How does NSZD change the composition of residual LNAPL over time?
- The driver on the required duration of LNAPL release site monitoring is the restoration of groundwater to specified criteria for individual LNAPL constituents of concern (e.g., attainment of drinking water standards for benzene). As NSZD proceeds and residual LNAPL is depleted, how does that translate into changes in LNAPL-groundwater partitioning and improvement in groundwater quality?
The state-of-the-science on these issues is discussed below. Given the rapid rate at which NSZD is evolving and maturing as an LNAPL site management tool, the user is encouraged to check the current literature for the latest developments if these issues are deemed critical to LNAPL site management decision-making.
With the current state-of-the practice, NSZD rate measurements provide a measurement of the bulk hydrocarbon depletion rate. To date, most measurements have provided NSZD rates in a relatively narrow range. An analysis of rate information from 25 sites revealed the middle 50 percent of sites exhibited NSZD rates falling between 700 and 2,800 gallons/acre/year, with a median of approximately 1,700 gallons/acre/year ([popuppress id=”43142″]).
Projecting LNAPL zone longevity requires an estimate of the current LNAPL mass, an understanding of average annual NSZD rates across the LNAPL body, and a projection of how NSZD rates will change over time. Understanding an average annual NSZD rate will typically require enough measurements to assess and account for shorter-term rate variability resulting from factors that may include seasonal patterns in temperature, vadose zone soil moisture content, and water table fluctuations.
In the absence of long-term NSZD studies, there is uncertainty about the changes in the NSZD rate over time. Based on several lines of evidence, a zero-order depletion rate can be assumed for much of the life of an LNAPL release, until only a low saturation or LNAPL or a relatively recalcitrant fraction is left ([popuppress id=”43142″]).
The biodegradation processes of NSZD do not reduce LNAPL mass solely via dissolution into the aqueous phase. LNAPL mass may also be depleted by direct oil contact biodegradation and outgassing without dissolution. The known microbial biodegradation mechanisms are:
1. Uptake of soluble LNAPL constituents in the aqueous phase.
2. Uptake of hydrocarbon microdroplets that have been pseudosolubilized by microbial biosurfactants.
3. Uptake of hydrocarbons by microorganisms that grow in fatty acids that are in direct contact with LNAPL.
The second and third mechanisms may also deplete less soluble and insoluble hydrocarbons. Together, these mechanisms may contribute to zero-order NSZD rates ([popuppress id=”43142″]); (Hua and Wang 2014); (Meckenstock et al. 2014).
It is sometimes assumed that the bulk NSZD rate will eventually decrease as the LNAPL is depleted of its more volatile, soluble, and bioreactive constituents. It has been further hypothesized that LNAPL depletion will reach a ‘break point’, where LNAPL depletion and/or compositional change results in a reduction of rates and transition to first-order rate kinetics. (Siddique et al. 2008) report zero-order rates when naphtha concentration oil sands was over 5,000 mg/Kg in, soil and first order for lower concentrations.
Similar to the issue of changes in bulk NSZD rates over time, there is currently insufficient information to allow quantitative projections of the long-term changes in LNAPL composition and associated COC partitioning to groundwater. Specific hydrocarbon compound degradation is highly dependent upon dissolved concentration, microbial diversity, and subsurface heterogeneity (Zeman et al. 2014). In a study of the volatile hydrocarbon content of an LNAPL over a 21-year period, depletion of individual volatile hydrocarbons from the LNAPL ranged from 13 to 64 percent (Baedecker et al. 2011). Earlier studies by the U.S. Department of Defense showed BTEX weathering from oil varied based on spill age, relative solubility, LNAPL geometry, and the rate at which groundwater and precipitation contact the mobile LNAPL (Parsons 2003). The average observed total BTEX, first-order weathering rate for jet fuel number 4 (JP-4, a 50:50 kerosene-gasoline blend) was 15 percent by mass per year, with the lowest rates occurring at sites with low groundwater velocities.
In the evolution of an LNAPL release, reductions of an order-of-magnitude or more in concentrations of COCs such as benzene are often seen in the aqueous phase plumes that emanate in the down-gradient direction from an LNAPL zone. However, within and immediately adjacent to the LNAPL body, aqueous phase COC concentrations are typically more persistent and stable. NSZD weathering effects and associated improvements to water quality within or close to the LNAPL are too complex for accurate, quantitative projections with current models. Better understanding of these long-term effects will require long-term field studies or comparative studies of similar release sites at different stages of evolution. However, this detailed information is not necessarily required for implementation of NSZD as a remedy. In situations where potential receptors are not at risk, risk management measures such a groundwater management zone are available (see Section 5.3.2), and where site conditions generally remain the same, then an understanding of bulk LNAPL mass loss rates will often be sufficient for purposes of assessing the appropriate role of NSZD in site remediation and risk management.
5.2 NSZD Side-Effects
As described in Section 2, NSZD processes result in changes to groundwater geochemistry. Intrinsic bioremediation processes in the core of the LNAPL zone will drive geochemical conditions to a lower oxidation-reduction potential (ORP) than in the background, surrounding zone of saturation. As a result, groundwater within and downgradient of the LNAPL zone often exhibits higher concentrations of total dissolved solids and reduced metals (e.g., iron, manganese, and in some cases, arsenic). Within and near the LNAPL zone, these changes to inorganic groundwater geochemistry will persist for as long as the LNAPL continues to undergo NSZD. Experience has shown that most mobilized metals oxidize and precipitate when groundwater conditions downgradient of the LNAPL/NSZD zone return to background (ITRC 2008) and (EPA 2013).
It is often presumed that the carcinogenic indicator compounds (e.g., benzene, ethylbenzene, and naphthalene), rather than other petroleum compounds that may be present at petroleum release sites, drive risk-based decision making. Through NSZD processes, hydrocarbons undergo “weathering” and biotransformation, and a current topic of inquiry is the extent to which degradation products, particularly polar metabolites, should be considered in LNAPL site risk assessment and risk-based site management decision-making. The polar metabolites that have been detected in petroleum release sites consist almost entirely of hydrocarbon oxygenates (Zemo et al. 2013); (Bekins et al. 2016) that include alcohols, phenols, aldehydes, ketones, and acids/esters. The chemistry and toxicity of these petroleum metabolites are issues of current interest. The ITRC TPH Risk project is evaluating this issue, and the work product from this ongoing project should be consulted for additional information on this topic.
5.3 Remedy Considerations
The following list discusses key considerations for making decisions related to NSZD and incorporating NSZD into an LNAPL site management strategy.
- LNAPL mass depletion occurs through a combination of natural processes (volatilization, dissolution, and biodegradation) that change the composition and reduce the saturation of the source LNAPL. These natural processes are observable at all LNAPL release sites with mobile or residual LNAPL. The rate that these processes deplete LNAPL mass, the bulk NSZD rate, can be quantitatively estimated through a variety of methods. The NSZD rate serves as the basis by which NSZD may be evaluated as a remediation alternative.
- NSZD is an important component in each step of the LCSM including the Initial, Remedy Selection, and Design and Performance LCSMs (see also Figure NSZD-5):
- Initial LCSM: The NSZD processes are one reason LNAPL plumes are typically stable (not migrating).
- Remedy Selection LCSM: There are a variety of ways in which NSZD may appropriately be incorporated into an LNAPL site remedy: i) as a benchmark to compare the effectiveness or efficiency of other remedies, ii) as the final step in a treatment train to achieve remedial objectives, iii) as an “up front” remedy for a portion of the site, or iv) as the primary remedy for older, stable LNAPL sites.
- Design and Performance LCSM: An NSZD monitoring program that is designed to evaluate progress toward meeting the remedial goals will often be appropriate. These goals could include: i) reducing mass within the LNAPL source zone to achieve LNAPL body stability (saturation objective), ii) maintaining effective NSZD processes in the LNAPL source zone to achieve mass losses that are comparable or better than LNAPL fluid recovery systems (saturation objective), and/or iii) mitigating dissolved contaminant plume migration (composition objective).
- If NSZD is selected as a remedy, it is important to establish SMART (specific, measurable, attainable, relevant, and timely) performance metrics. Examples include i) sustained NSZD mass loss rates in core areas of the LNAPL body, ii) NSZD mass loss rates in excess of measured lateral LNAPL flux through monitoring wells, iii) stable lateral footprint of the LNAPL body as indicated by maintained absence of in-well LNAPL in select perimeter sentinel wells, iv) stable and/or receding geospatial distribution of the dissolved phase contaminant plume, or v) reduced mole fraction of COCs in the LNAPL.
- At sites where the LCSM establishes the role of NSZD processes in the evolution of the LNAPL release, and NSZD processes have progressed to a point where both composition and saturation concerns are eliminated, aqueous and vapor phase plume and LNAPL footprint have stabilized and are contracting, and potential receptors are not at risk, NSZD merits consideration as the primary remedy component.
- At some sites, NSZD may be the primary remedy component for portions of the LNAPL zone, allowing engineered remediation systems, including enhanced-NSZD, to be focused on those portions of the LNAPL footprint where achieving remedial goals requires more aggressive remedies and will provide the most benefit to reduce or mitigate saturation concerns (e.g., LNAPL recovery near the release area where significant volumes of recoverable LNAPL still exist, or where the LNAPL footprint extends to a receptor exposure point [e.g., sheen discharge to surface water]).
- NSZD will often be implemented as the final step in a treatment train, whereby an initial remedy has achieved its endpoint prior to achieving the site-wide remedial objectives, and the remedy then transitions to NSZD for long-term risk management. With appropriate evaluation of NSZD and incorporation into the Design and Performance LCSM, the transition to NSZD can be a part of the specified remedy, implemented within the framework of a performance monitoring plan, and triggered by achievement of a pre-established performance metric (e.g., a specified mass removal/recovery rate, LNAPL transmissivity, or plume stability demonstration).
- At many sites that are already in the remediation and performance monitoring phase, the decision framework for determining the endpoint of the implemented remedial technology is not often well prescribed or technically achievable. For these sites, practice has evolved to use multiple lines-of-evidence to justify transition. For example, the (NRC 2013) proposes taking risk reduction, life-cycle costs, and technical feasibility into account during a transition process that is transparent, reduces long-term risks to an acceptable level, and is practical and cost effective. Based on these considerations, transition to NSZD as the final remediation component will merit consideration at many sites.
- When the remedy transitions to NSZD, LNAPL composition and/or saturation concerns may still be present (e.g., dissolved-phase concentrations above cleanup standards or mobile LNAPL is present in monitoring wells). In some regulatory settings, a demonstration that LNAPL concerns are controlled and NSZD continues to deplete the LNAPL source may be adequate to support a No Further Action decision.
- In other regulatory settings, the implementation of NSZD to remedy LNAPL concerns requires performance monitoring to assure protection of potentially exposed populations and assess progress toward meeting the remedial goals. Depending on site-specific considerations, NSZD performance metrics could include the SMART performance metrics discussed in Item 3. The monitoring program could include one or more of the methods described in Section 3 and Section 4, or could incorporate more traditional long-term monitoring methods (see Figure NSZD-5).
- To provide an appropriate level of protectiveness and ensure NSZD remedy performance, it will often be appropriate to include contingency planning in the NSZD remedy. If the performance of NSZD is not adequate, and the monitoring data indicates that the remedy fails to meet one of the performance metrics, then the remedy must be adjusted or optimized to achieve remedial goals. (ITRC 2006) prescribes decision logic for optimization and contingency planning to achieve the stated performance monitoring objectives.
5.3.1 Remedy Transition to NSZD and Case Studies
Remedy Transition
Almost all remedial technologies (e.g., LNAPL fluid recovery, multiphase extraction) will progress to a point where mass removal rates become relatively low, and continued operations will remove small additional amounts of mass that are insignificant relative to the cumulative mass reduction previously achieved. At this point, the level-of-effort in continued operation will not provide commensurate value in terms of increased environmental protection and/or risk reduction, and the practical endpoint of the engineered mass removal technology will have been achieved. This is the appropriate point for transition.
Often, there comes a time during remedy implementation (i.e., of an LNAPL fluid recovery system) when the monitoring data indicates that a change or remedy optimization is needed. A remedy transition is a process by which an ineffective and/or inefficient remedy is stopped and another remedy is started or an ongoing remedy such as NSZD is put in the lead role to more effectively and efficiently achieve remedial objectives. LNAPL remedial technology transition is discussed in the main body text, Section 5.4.5. NSZD will often be a component of an LNAPL site remedy and in some cases part of a treatment train approach (as discussed in Section 5.4.4 of the main body text), whereby an initial remedy is deployed to reduce mass and after it has achieved its goal, will transition to NSZD.
The basis for remedy transition is well founded in the existing literature. The National Research Council (NRC) realized that complex sites, inclusive of LNAPL, require an adaptation to the post-remedy-selection decision-making process that incorporates alternative protective end states other than clean closure (ITRC 2017a) and (NRC 2013). For example, NRC states “Specifically, if data indicate that contaminant concentrations are approaching an asymptote [and optimization has been exhausted], resulting in exponential increases in the unit cost of the remedy, then there is limited benefit in its continued operation. At this point of diminishing returns, it is appropriate to assess whether to take additional remedial action (if legally possible) or whether to transition to more passive long-term management.” The NRC goes on to provide recommendations for a transition assessment that can accelerate the transition of sites to several end states, one of which includes “…long-term passive management (e.g., using natural attenuation [NSZD for LNAPL] with or without monitoring, physical containment, permeable reactive barriers, institutional controls, or some combination thereof)…” Additionally, the ASTM Standard Guide for Greener Cleanups (ASTM 2014c) recommends switching to a less energy intensive technology for the final steps of remediation when possible (for example, suspend pump and treat or SVE and initiate bioremediation or phytotechnology) when overall energy balance supports the concept.
A flowchart that illustrates the decision logic leading to remedy transition to NSZD (modified from ITRC’s Complex Sites guidance document (ITRC 2017b) is presented in Figure NSZD-14. This flowchart addresses the common scenario where a specified remedy contains both NSZD and an interim active remedy, and assumes performance and endpoint metrics were established for both remedy components. These metrics allow for clear decision making during the monitoring phase of the project. Similar flow charts may be found in other guidance documents (LALWG 2015); see Figure 8-1).
The impetus for transition to NSZD is typically triggered by achievement of a pre-established performance metric such as:
- a specified LNAPL recovery rate (e.g., a rate that is not significantly greater than the NSZD rate, or that a feasibility study establishes as not providing commensurate value relative to NSZD considering various aspects of effectiveness and cost)
- a specified LNAPL transmissivity
- demonstration of LNAPL plume stability for a specified period of time
- remedy performance has reached its practical limit (e.g., steady COC concentrations in groundwater or negligible rate of rise in an active recovery system cumulative mass removal curve)
In many cases, the active (interim) remedy will have achieved its performance metric, but COC concentrations in environmental media (most typically groundwater) in excess of remedial objectives will still persist. As shown on Figure NSZD-14, when the performance metric for the active remedy is met, it is time to transition.
For the scenario when no transition criteria have been established, the decision logic in Figure NSZD-15 can also be used. In these situations, an additional step is needed. When the decision criteria or logic for transition to NSZD is not well prescribed in decision documents, but the need emerges for remedy transition to a more effective and efficient approach (e.g., when a mass removal plateau is observed), practice has generally evolved to use multiple lines-of-evidence to justify transition. For example, the (NRC 2013) proposes taking risk reduction, life-cycle costs, and technical feasibility into account during a transition process that is transparent, reduces long-term risks to an acceptable level, and is practical and cost effective. Figure NSZD-15 presents a flowchart that can be used to assess a newly defined need for remedy transition. In this scenario of a newly defined need for remedy transition, the decision-making process will be a site-specific judgment involving input from all key stakeholders.
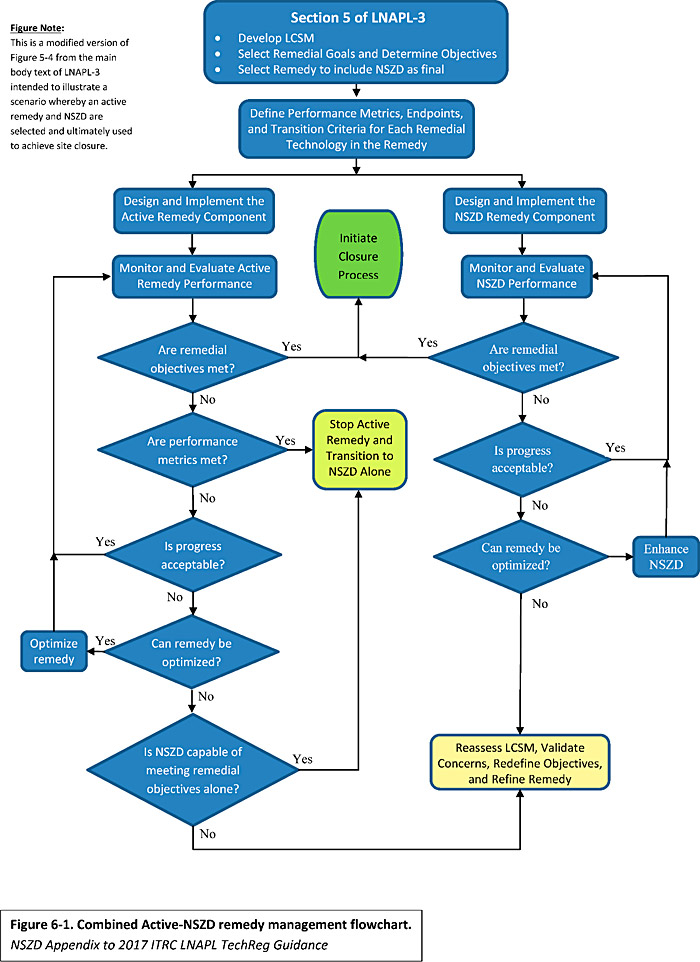
Figure NSZD-14. Combined active-NSZD remedy management flowchart.
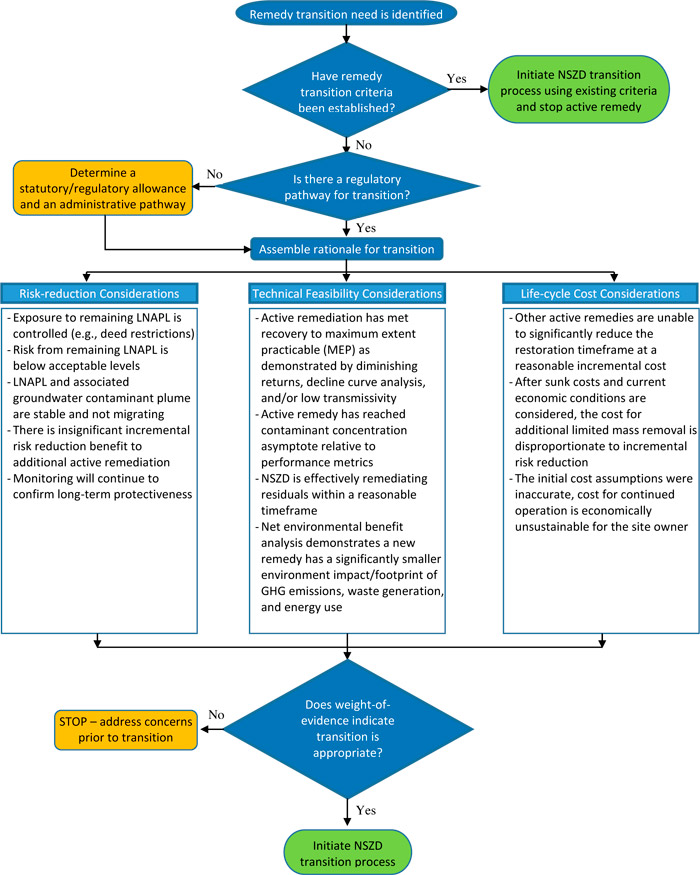
Figure NSZD-15. New transition need flow chart.
To illustrate the use of multiple lines-of-evidence to justify transition from LNAPL fluid recovery to NSZD, three case studies are presented on Insets NSZD-1 through NSZD-3.
Inset NSZD-1. Case Study 1 – Selection of NSZD Remedy ▼Read more
Inset NSZD-2. Case Study 2 – Transition from LNAPL Fluid Recovery to NSZD ▼Read more
Inset NSZD-3. Case Study 3 – Agency Approval of NSZD as Long-Term LNAPL Remedy ▼Read more
Enhancing NSZD
NSZD performance monitoring and evaluation could potentially identify situations in which NSZD is not maintaining sufficient progress toward attainment of remedial objectives. In such a situation, alternatives for enhancing the rate of biotic mass removal processes should be considered. Alternatives could include enhancing the rate of prevailing biotic reactions (thermal enhancement of methanogenesis) or switching to faster processes (e.g., bioventing to support aerobic biodegradation in zones that are currently methanogenic).
5.3.2 NSZD Implementation and Remedy Endpoint
There will come a time during the performance monitoring phase when the remedial goals and objectives are met. When this occurs, the remedy may be discontinued and the site proceeds to a no further action (NFA) or closure state.
The ITRC (2006) has documented the advantages of an exit strategy for remediation. A key component of the exit strategy is the decision logic to terminate a response action. Firm endpoint criteria are necessary to determine when an LNAPL remedy is complete and avoid perpetual remediation without compensatory environmental benefit. It is most productive if the shutdown and endpoint criteria and decision logic leading to them are documented and agreed upon by the project stakeholders in advance of remedy implementation. Gaining up-front consensus on the process that will be used to determine when the LNAPL remedy will be deemed complete is invaluable to the efficiency of remedy completion. Each remediation technology/system should have its own endpoints.
The endpoint of an NSZD remedy will vary based on site-specific conditions, the governing regulatory program, and how NSZD is used as a remedial technology. Table NSZD-4 lists viable NSZD remedial endpoints for various regulatory programs and the monitoring data that can be used to support NFA or closure proceedings.
Generally, when the remedy transitions to NSZD, LNAPL composition and/or saturation concerns may still be present (e.g., dissolved-phase concentrations above cleanup standards or mobile LNAPL is present in monitoring wells). In some regulatory settings, the implementation of NSZD to address remaining LNAPL concerns will require performance monitoring to assure protection of potentially exposed populations, assess progress toward meeting the remedial goals, and/or demonstrate continued LNAPL depletion through NSZD for a period of time. Depending on site-specific considerations, NSZD performance metrics could include the SMART performance metrics (see “key considerations” item 3 at the beginning of Section 5.3). The monitoring program could include one or more of the methods described in Sections 3 and 4, or could incorporate more traditional long-term monitoring methods (see Figure NSZD-5).
To provide an appropriate level of protectiveness and ensure NSZD remedy performance, it may be appropriate to include contingency planning in the NSZD remedy. If the performance of NSZD is not adequate, and the monitoring data indicates that the remedy fails to meet one of the performance metrics, then the remedy must be adjusted or optimized to achieve remedial goals. (ITRC 2006) prescribes decision logic for optimization and contingency planning to achieve the stated performance monitoring objectives.
If NSZD is used as a terminal remedy (i.e., the final step in a combined remedy), then its endpoint will often be defined as attainment of the remedial objectives. In some regulatory settings, a demonstration that LNAPL concerns are controlled and NSZD will continue to deplete the LNAPL source may be adequate to support a No Further Action decision. For a detailed example of the development of a remediation process endpoint for situations where a significant mass of residual LNAPL in the subsurface cannot or is technically impracticable to remove, see the “Residual Management Zone” concept (LALWG 2015).
Table NSZD-4. Example NSZD remedial endpoints associated with various regulatory considerations
| Regulatory Framework or Scenario | Possible Remedial Endpoint for NSZD1 | Indicator Data2 |
|---|---|---|
| LNAPL removal to the maximum extent practicable (MEP) | Sustained NSZD mass loss rates | Periodic or continuous NSZD rate measurements for a demonstration period of sufficient duration (will vary) |
| Risk-based corrective action (RBCA) | No unacceptable risk to human health or the environment | COC concentrations at potential receptor locations are below risk-based criteria
LNAPL is being degraded and the aqueous phase plume is at steady-state or declining status |
| Attainment of specified water quality criteria throughout the zone of impact | In some jurisdictions and for some sites, the criteria may be based on potable groundwater use (e.g., Maximum Contaminant Levels) | Groundwater samples and analysis for COCs |
| LNAPL Residual Management Zone or similar | LNAPL is residual in nature and not migrating and NSZD is documented as occurring and ongoing | No detection of LNAPL outside the limits of the management zone |
Notes:
|
||

